Where Women Work and How Much They Earn in Oregon
by Kale Donnelly
 Workforce Analyst
 Crook, Deschutes, Gilliam, Hood River, Jefferson, Sherman, Wasco, and Wheeler counties
 kale.donnelly@oregon.gov

More than 930,000 jobs in Oregon businesses or state and local governments were held by women in 2019. Women represent 49 percent of employment in Oregon, but the share of jobs held by women varies considerably by industry. We now know that the latest period of economic expansion peaked in 2019, on an annual basis, so these figures represent the Oregon economy at peak, prior to the onset of the pandemic recession in early 2020.
Women’s average earnings were $3,846 per month in 2019, an inflation-adjusted growth rate of 2.4% from 2018. This continues a trend of growth in women’s average wages that has exceeded the growth of total average wages throughout the United States. Earnings for women, just like employment, vary by industry.
Women’s Employment by Industry
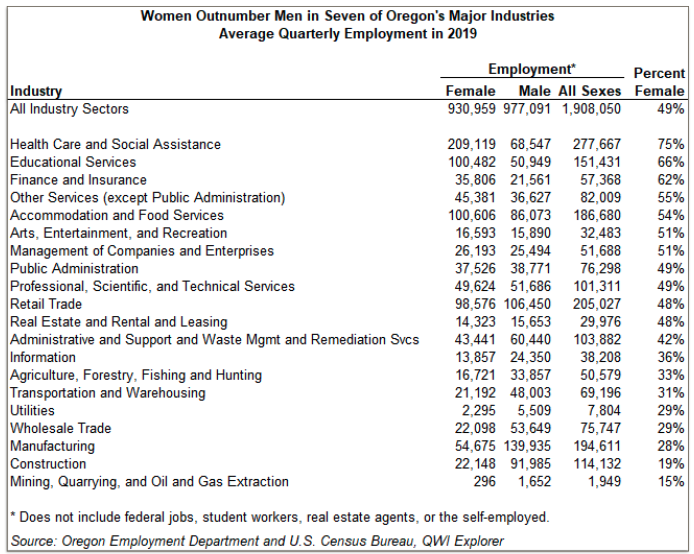
Women outnumbered men in seven of Oregon’s 20 major industry sectors. The biggest difference between women and men in industry sectors is in health care and social assistance, where three out of four jobs are held by women. Other noticeable majorities of women in the workplace are in educational services (66%) and finance and insurance (62%). In contrast, women are noticeably missing from mining (15%) and construction (19%) worksites.
The health care and educational services industries not only have the greatest share of jobs held by women, but also top the list for greatest number of women employed in all of Oregon’s industries. More than 209,000 of the jobs in health care and social assistance were held by women, while just over 100,000 women are employed in educational services. While it’s not one of the industries with the greatest share of women, the accommodation and food services employs the second greatest number of women with over 100,000 jobs – marginally more jobs held by women than in educational services.
Women’s Average Earnings by Industry
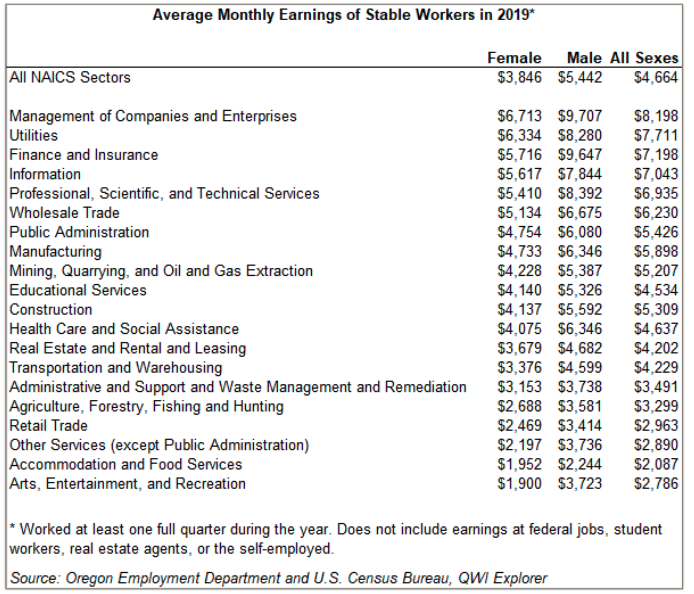
Average monthly earnings for women in 2019 were $3,846. The industries where women earned the highest average income were management of companies and enterprises ($6,713), utilities ($6,334), and finance and insurance ($5,716). These industries have a higher average wage, overall. Industries where women earned the least in terms of average income were arts, entertainment, and recreation ($1,900), accommodation and food services ($1,952), and other services ($2,197). Similarly, these industries tend to have a lower average wage, overall.
In every industry, average monthly earnings of women were lower than men’s earnings. The ratio of women’s earnings to men’s ranged from a relatively close 87% in accommodation and food services to 51% in arts, entertainment, and recreation. There are many factors behind these disparities in earnings, such as the number of hours worked, the relative wages of occupations with higher concentrations of women within these industries, and the propensity for women to hold or be promoted into management positions with higher rates of pay. Unfortunately, that information is not available from this particular data source.
Trends in Women’s Employment and Earnings
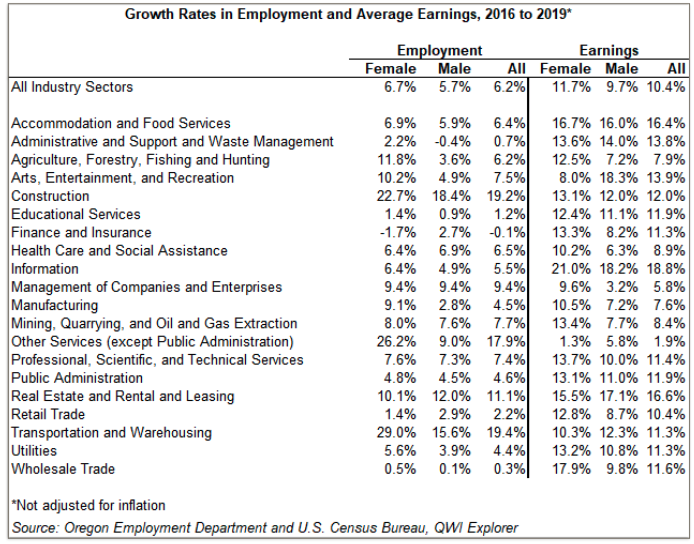
The growth rate in employment for women (6.7%) from 2016 to 2019 was slightly higher than that for men (5.7%). Women’s employment growth was the highest in transportation and warehousing (29.0%), other services (26.2%), and construction (22.7%). Employment growth for women was slowest in wholesale trade (0.5%), and even negative in finance and insurance (-1.7%).
Earnings growth for women from 2016 to 2019 outpaced that for men in 15 out of 20 industries. Average earnings growth was highest in the information industry (21.0%) and lowest in other services (1.3%). Overall, average earnings for women grew roughly 2% faster than for men.
The Wage Gap
The above data provide industry detail about the earnings of women and men in Oregon not available from other sources, but they do not help explain why women have smaller paychecks than men on an aggregate level. On average, women in Oregon earn 71% of what men earn (not accounting for hours worked or type of job). Accounting for hours worked might partially explain the wage gap. According to an article published by the Bureau of Labor Statistics in 2018, women who were full-time wage and salary workers had median weekly earnings that were 81% of the median earnings for men who were full-time wage and salary workers. In other words, the number of hours worked could account for more than one-third of the difference in earnings between women and men in Oregon.
Perhaps a lack of equal representation of the sexes in upper management positions (significantly higher paying jobs) could explain why average earnings of women are less than the average earnings of their male counterparts. A more timely analysis from McKinsey & Company examines how COVID-19 has affected women in the workplace at the national level, and paints a picture where less and less women are employed in management positions as you move up the corporate pipeline. At the start of 2020, 47% of survey respondents reported women in entry-level management positions, while only 21% were in “C-suite” management positions. Read more on the results of this expansive study, and the effects that COVID-19 has had on women’s involvement in the labor force: Women in the Workplace 2020.
To better understand the effects COVID-19 has had on women’s employment in Oregon, please read one of our articles from January 2021: Disparate Impact: COVID-19 Job Losses by Sector and Gender in Oregon
Another insightful article of ours details how Oregon’s working parents, particularly women, have a different relationship with the labor force than Oregon’s workers without children: For Oregon Parents, Working Is the Norm
Outside of the Oregon Employment Department, many analytics firms and organizations have studied the root causes of the wage gap that persists to this day. A more detailed exploration of these causes of the wage gap would need to explore other data that likely includes job types, hours worked, upward mobility by sex, as well as cultural and social factors.
There are a number of articles on our website that address the topic of women in the workforce. Visit QualityInfo.org and search for “women” to see a list of available articles.
Employment and Earnings by Sex Data
Information about employment and earnings by industry and sex is from the U.S. Census Bureau’s Local Employment Dynamics (LED) partnership with the states. LED provides the most comprehensive data available for employment and earnings of women and men at the state and county level. Employment data is the average of quarterly employment for 2019. Earnings are the average of quarterly earnings in 2018 of workers who worked at least one full quarter during the year.
To explore and use the data available from LED, visit lehd.ces.census.gov.

Advertisement