Oregon’s Growing Hispanic Workforce
SOBJ June 2021
BY ERIK KNODER
REGIONAL ECONOMIST
CLATSOP, COLUMBIA, LINCOLN, AND TILLAMOOK COUNTIES
Oregon’s Hispanic population continues to increase and so do the number of Hispanics in Oregon’s labor force. The Hispanic population has a higher labor force participation rate and Hispanics are employed at higher rates than whites who are not Hispanic. In fact, their rate of employment may have increased slightly since 2010 as unemployment rates dropped for most groups as Oregon’s economy recovered from the Great Recession.
From 2006 through 2010 Hispanics were an average of 8.9% of Oregon’s population ages 16 and over – the ages that the labor force is drawn from. Hispanics had a higher rate of labor force participation (73.5%) than non-Hispanic whites (63.4%), and they had a higher rate of employment (66.0%) than non-Hispanic whites (58.1%).
As the economy improved after the Great Recession in the years 2013 through 2017, labor force participation dipped slightly for both Hispanics and non-Hispanic whites. (The labor force includes both employed and unemployed people and can decline as the number of unemployed people declines.) The share of people who were employed diverged for the two groups, however. The average share of Hispanics who were employed increased slightly to 66.9% and the share of non-Hispanic whites who were employed decreased to 56.7%.
In fact, the Hispanic population has grown to account for more than 13% of the population in Oregon and continues to make up a significant and growing portion of our labor force. For the years 2015 through 2019, Hispanics had the third-highest employment-to-population ratio (68.2%) of all major racial and ethnic groups published by the Census Bureau. The only groups with a higher employment ratio were “Some Other Race” with 71.3% and “Native Hawaiian and Other Pacific Islander Alone” with 70.3% of the population employed.
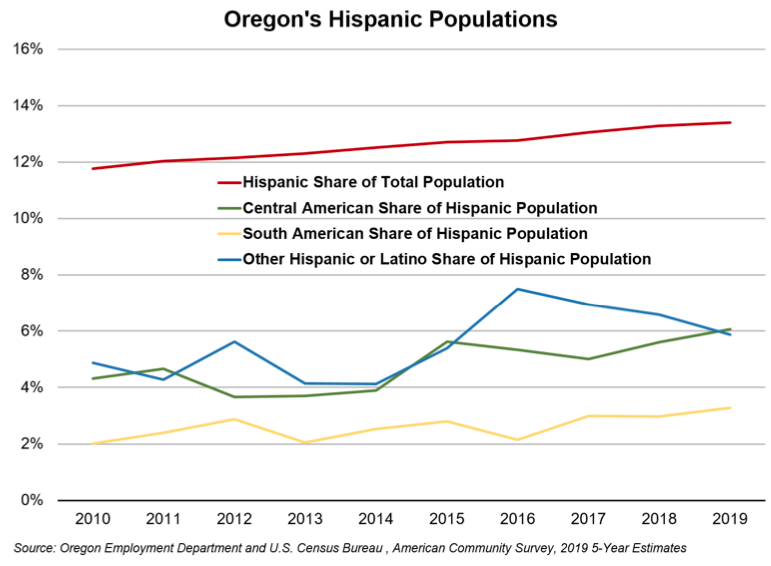
Another thing that is changing about Oregon’s Hispanic population is their origin. A small but increasing percentage of Hispanics are stating that their origin is from areas other than Mexico. The shares of Hispanics from South America, Central America, and other areas, such as Spain, have been slowly increasing since at least 2010 and the share of Hispanics in the state who claim an origin of Mexico dropped from 85% in 2011 to 81% in 2019. After Mexico, the second largest share was Hispanics who claimed a Guatemalan origin (2.9%), followed by a Puerto Rican origin (2.2%), and a Spanish origin (1.9%).
One reason that an increasing share of Oregonians are Hispanics may be because they have had larger average family sizes than non-Hispanics, although this difference has been decreasing. In 2010 the average family size for Hispanics households in Oregon was 3.93 people, and for non-Hispanics it was 3.05 people. In 2019, the average size for Hispanic households had dropped to 3.70 people, and for non-Hispanics it was 3.03 people.
The growth of the Hispanic population has attracted research into its national economic benefits. Gonzalo Huertas and Jacob Funk Kirkegaard of the Peterson Institute for International Economics estimate that, “The Hispanic demographic dividend will likely contribute 0.21 percentage point to the annual real GDP growth rate over the next 25 years.” UNIDOS U.S. estimates that 30% of the U.S. workforce will be Hispanic by 2050. And finally, Robert W. Fairlie and others at the Kauffman Foundation have shown that Hispanics have the highest rate of entrepreneurship (business startup) of any major racial and ethnic group.
Much of this outsized economic impact is due to the younger age structure of the Hispanic population in the U.S. The increasing share of Hispanics in Oregon bodes well for the state’s economic future.

Advertisement