Wage Inequality in Oregon: A Wide Gap
Over the past 30 years, the distribution of wage income in Oregon has generally continued to become more unequal. In 2020, employees who worked all four quarters of the year earned a total of $94.2 billion in covered wages, more than twice the (inflation-adjusted) total earnings of four-quarter workers in 1990. The number of four-quarter workers rose by 57% during that time period, with the average four-quarter inflation-adjusted wage rising from $44,200 to $61,500. The gains in wage income, however, have not been evenly shared by all workers. High-wage workers’ slice of the wage pie has increased in size, while that of low- and middle-wage workers has shrunk.
Top Earners Pull Away From the Pack
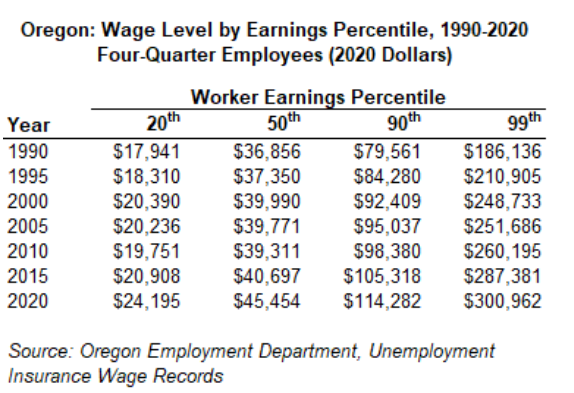
One way to track the degree of wage inequality is to compare wages by earnings percentile. To derive the value of a given earnings percentile, the wages of each worker are computed and then all workers’ wages are sorted from lowest to highest. The wage associated with a given percentile is the highest wage earned by that percentage of the workforce.
In 2020, the bottom 20% of year-round Oregon wage earners made $24,195 or less and the bottom half of wage earners made $45,454 or less. The top 10% of year-round workers in the state made more than $114,252 and the highest earning 1% made more than $300,962, their real (inflation-adjusted) wages having risen by 61.7% since 1990. Between 1990 and 2020, the real wages of the lowest-paid of the top 10% rose 43.6%. The maximum wage of the lowest 20% increased by 34.9%, undoubtedly boosted significantly by recent increases in Oregon’s minimum wage. (In 2015, the increase over 1990 for the maximum wage of the lowest earning percentile had been only 8.3%.)
The gap between the 50th percentile wage value and higher percentile wage values has gradually widened over time. The ratio of the 99th percentile to the 50th percentile wage was 5-to-1 in 1990, steadily widened to more than 7-to-1 in 2015, and since then has decreased just slightly. Over the same period, the gap between the wage of the bottom 20th percentile and the 50th percentile shrank a little, from just over to just under 2-to-1.
Middle-Wage Workers Get Left Behind
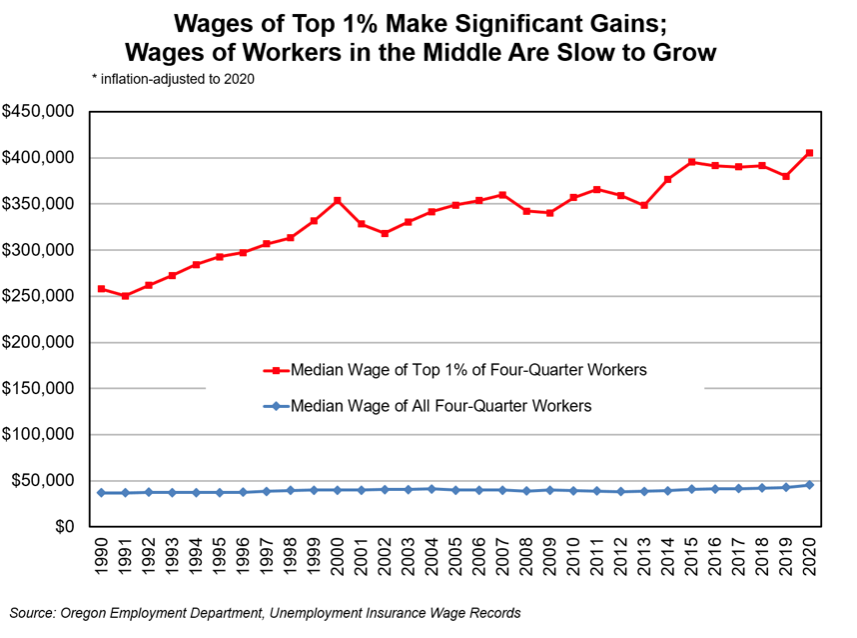
Between 1990 and 2020, the median inflation-adjusted wage of all four-quarter Oregon workers rose by only 23.4%; an increase, on average, of 0.7% per year. Between 2019 and 2020 the median rose to the 30-year high of $45,454, up 6.1% over 2019. The large jump in the median was likely due primarily to the loss of lower-wage jobs during the pandemic.
The median wage of the top 1% of all four-quarter workers rose by 57.2% over the past 30 years, from an inflation-adjusted $258,060 to $405,720. The upward trend was disrupted during the 2001 and 2008 recessions and again in 2012, when the wages of the top earners dropped for two straight years. It is likely that annual bonuses for this group of workers were considerably lower during these periods of economic slowdown. After two years of significant increases (7.5% in 2014 and 4.6% in 2015), the median wage of this group remained relatively stable through 2018, dropped a little in 2019, and rose by 6.3% in 2020.
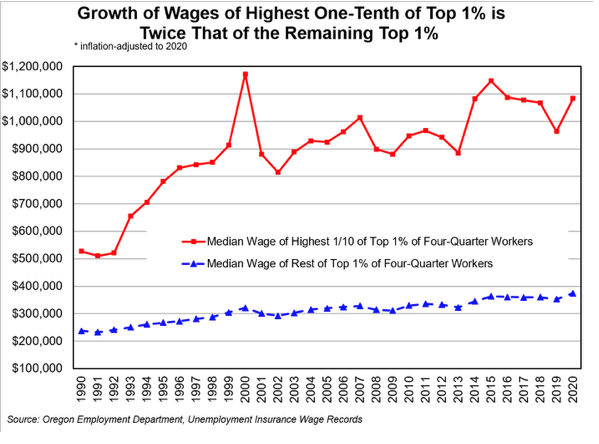
Between 1990 and 2020, the median wages of the top 0.1% of Oregon’s year-round wage earners doubled, growing by 105.3%. That was nearly twice the growth of the rest of the top 1%. Members of this group earned a minimum of $792,981 in covered wages in 2020. Their median wage that year was $1,083,558, about 8% lower than the pre-recessionary high ($1,172,877) that was achieved in 2000.
The Pie Grows, but Slices for Lower-Wage Earners Shrink
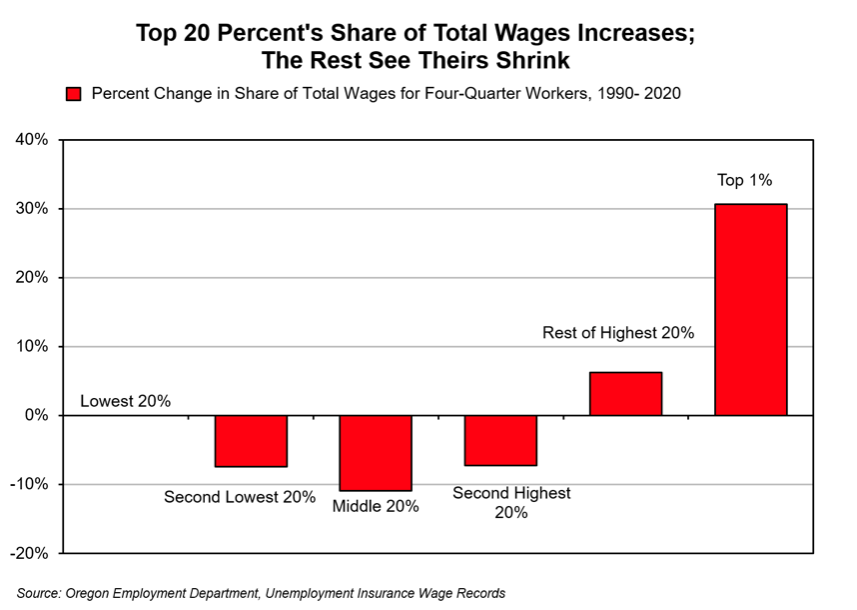
The percentage take – the slice of Oregon’s total wages pie – of the top 1% of Oregon’s four-quarter wage-earners has increased more than 30% over the past 30 years. This group of workers, and the remainder of the top 20%, were the only groups whose slice of the wages pie increased. Workers in the middle quintile (the middle 20% percent of four-quarter workers) saw their share of total wages shrink by 10.9% – more than any other group. The second lowest and second highest quintiles experienced nearly identical percentage losses, of 7.4% and 7.3%, respectively. The lowest quintile’s slice of the wages pie saw no change between 1990 and 2020. Just two years earlier, the comparable 1990 to 2018 percent changes, from the lowest to the highest percentile, were -2.6%,-8.9%, -12.0%, -7.9%, 6.4%, and 38.9%.
The dramatic changes seen in just two years likely resulted in large part from the disproportionate loss of lower wage jobs during the 2020 pandemic, and the increase in the percentage of all four-quarter wages earned by middle-wage workers. In 2018, for example, the lowest 20% accounted for 5.6% of all four-quarter wages; the second lowest earned 3.3%. In 2020, these two groups earned 5.9% and 3.5%, respectively, of all four-quarter wages. At the other end of the earnings spectrum, the top 1% of four-quarter workers earned a combined total of 7.4% less in 2020 than in 2018. Oregon’s increases in the minimum wage, which rose in several steps from $4.75 per hour to $12.00 per hour between 1997 and 2020, have also helped lower-wage workers increase their share of total wages.
Bumps on the Road, but the Gini Coefficient Continues to Increase
Beyond the comparisons of percentile groups, there are other indicators that help to measure wage inequality. One of those commonly used by economists is the Gini coefficient, based on the Lorenz curve that graphically displays the degree of income or wage inequality among workers. The larger the Gini coefficient, the greater the degree of wage inequality. A score of zero indicates perfect wage equality, where all workers earned the same wage. A score of one would indicate that only one worker earned all the wages. It is helpful to use annual Gini coefficients to see the pattern of changes in wage inequality over time.
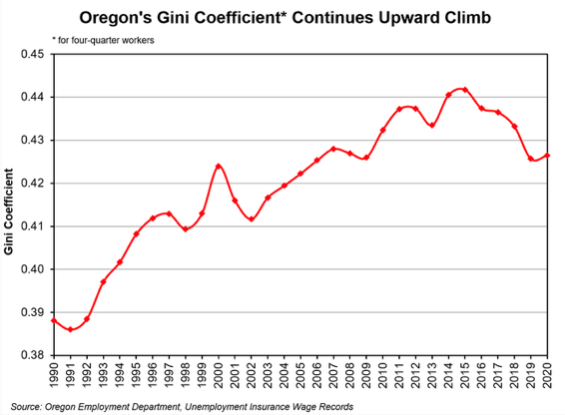
The degree of wage inequality in Oregon has generally increased since 1990, though not steadily. The state’s Gini coefficient for all year-round workers rose from 1991 through the mid-1990s, and then was largely flat before rising to a peak in 2000. Since 2000, the coefficient fell slightly in 2001 and 2002, during the first economic slowdown of the decade. Afterwards, it began a steady rise to a second peak in 2007, as the state’s economy recovered from the recession earlier in the decade. The coefficient decreased a little again in 2008 and 2009 and subsequently rose to reach its highest point in 2015. In each of four subsequent years, it dropped slightly, again possibly a result in part of Oregon’s minimum wage increases. In 2020, it saw no change.
Some Workers Are Not Included in This Study
This study analyzes wage records submitted quarterly by all employers for workers subject to unemployment insurance (UI) taxes in Oregon. That includes workers at most private employers as well as state and local government workers. Federal government workers covered by a separate UI system are not included. Roughly 90% to 95% of all private employees are covered by UI, with notable exceptions including the self-employed, workers paid solely by commission, and employees of small agricultural employers. Although workers not covered by UI affect wage distribution and inequality in Oregon, we were not able to include them because of the lack of data.
Wage distributions will vary depending on whether all workers or only full-time year-round workers are included. For many individuals, annual earnings are influenced by the number of hours or quarters worked during the year. Many workers have part-time or seasonal jobs. Others may take a new job in Oregon at some point during the year or leave the state for a job. Still others will drop from the wage files for various reasons, including death, disability, or retirement. Because such factors tend to reduce annual wages, the wage distribution will likely be wider for all workers than for those who are working full-time year-round. In 2020, the average wage for full-time year-round workers was $88,896, compared with just over $46,299 for all workers. Roughly two-thirds of Oregon workers are employed year-round; of these, slightly less than one-third work full time.
By Barbara Peniston
Special Projects Analyst
barbara.e.peniston@oregon.gov

Original posted at https://www.qualityinfo.org/-/wage-inequality-in-oregon-a-wide-gap

Advertisement