The Diversity of Oregon’s Industries
by Kale Donnelly
State of Oregon Employment Department
Workforce Analyst
Crook, Deschutes, Gilliam, Hood River, Jefferson, Sherman, Wasco, and Wheeler counties
kale.donnelly@oregon.gov
It should be noted that the racial and ethnic diversity of Oregon’s total nonfarm employment pales in comparison with the United States. The private sector of the U.S. in 2019 was comprised of a more racially diverse set of workers, with 24 percent non-white employment compared with Oregon’s 14 percent. Moreover, the ethnic diversity of the U.S. is more robust than Oregon – 17 percent of private employment is held by Hispanic or Latino workers compared with Oregon’s 13 percent share among the cohort. These metrics are almost entirely due to the demographical makeup of our state’s population. Still, even with somewhat limited diversity in Oregon’s total nonfarm employment, it’s worth observing which industries are most diverse, and examining how diversity by industry could potentially lend itself to an inequitable recovery following the initial impacts of COVID-19.
Race
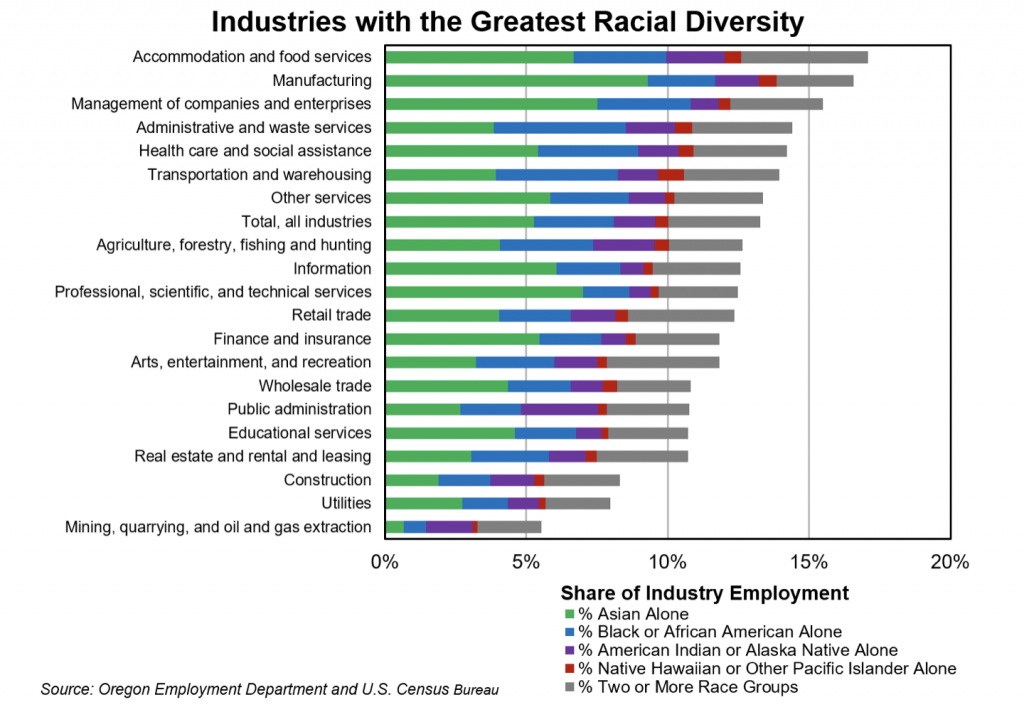
For this article’s definition of diversity, we’re looking at the industries with the greatest shares of people of color on average in 2019. Some of Oregon’s most racially diverse industries include accommodation and food services (17.1% share of people of color), manufacturing (16.6%), management of companies and enterprises (15.5%), administrative and waste services (14.4%), and health care and social assistance (14.2%). These are aggregate measures, but the differing industry shares of employment by each race is where the real differences lie.
For example, Asian workers hold 5 percent of Oregon’s total nonfarm employment. However, their highest shares of industry employment lie in manufacturing (9.3%); management of companies and enterprises (7.5%); and professional, scientific, and technical services (7.0%).
Black or African American employment in Oregon is aggregated at 3 percent, while their shares of industry employment are highest in administrative and waste services (4.7%); transportation and warehousing (4.3%); and health care and social assistance (3.6%)
American Indian or Alaska Native workers account for 2 percent of Oregon’s employment. Their highest shares of industry employment are in public administration (2.7%); agriculture, forestry, fishing and hunting (2.2%); and accommodation and food services (2.1%).
Native Hawaiian or Other Pacific Islander employment in Oregon accounts for just 0.5 percent of total employment. However, this cohort’s share of industry employment is highest in transportation and warehousing (0.9%); manufacturing (0.6%); and administrative and waste services (0.6%).
Workers who identify as two or more race groups comprise 3 percent of Oregon’s total nonfarm employment. Their highest shares of industry employment are in accommodation and food services (4.5%); arts, entertainment, and recreation (4.0%); and retail trade (3.8%)
Throughout these racial employment trends, we can see that each race’s industry trends shape the overall diversity of Oregon’s industries. The least racially diverse industries are the ones with the least representation of all races. In other words, the industries that have the greatest shares of white employment. These industries include educational services (89.3% white); real estate and rental and leasing (89.3% white); construction (91.7% white); utilities (92.0% white); and mining, quarrying, and oil and gas extraction (94.4% white).
Ethnicity
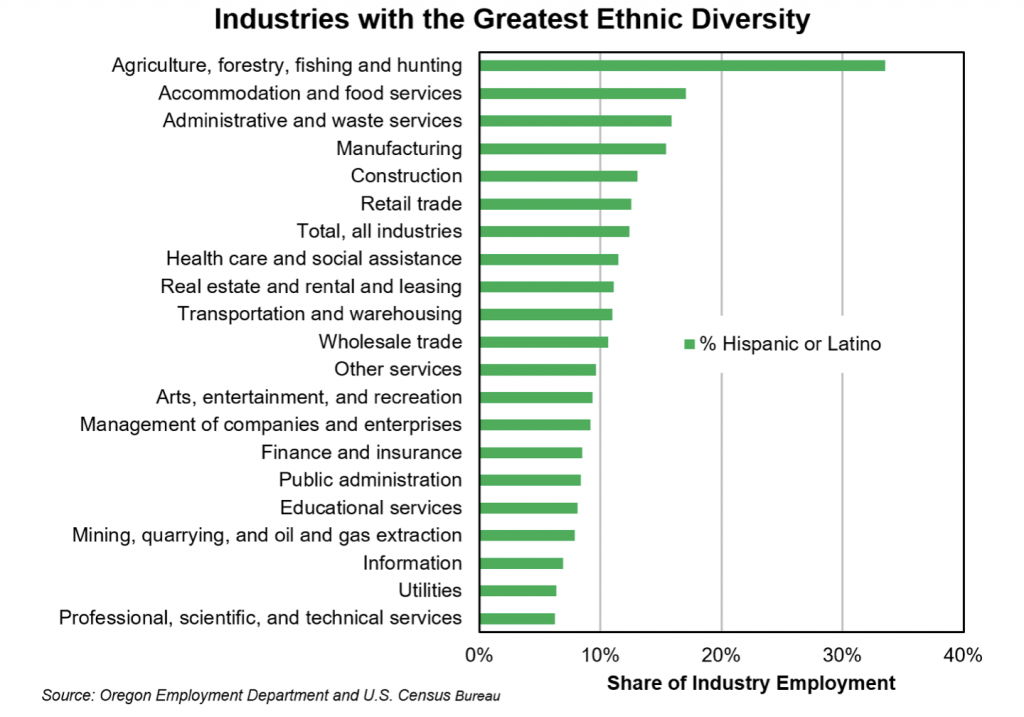
Looking at the ethnic diversity of Oregon’s industries, we see a similar trend in many industries for their lack of diversity, but others make some significant shifts. Comparing which industries have a higher share of Hispanic or Latino employment, we see that some are significantly more diverse than others.
The industries with the greatest share of ethnic diversity include agriculture, forestry, fishing and hunting (33.5% Hispanic or Latino employment); accommodation and food services (17.1%); administrative and waste services (15.9%); manufacturing (15.4%); and construction (13.1%). One important detail to note is that most agricultural employment is not captured in our traditional employment metrics since the majority of the industry’s employment isn’t covered by unemployment insurance. Therefore, the share of diverse employment in agriculture is likely understated in these graphs since they only capture a fraction of overall industry employment in the state.
Job Recoveries in the Most Diverse Industries
Some of the industries that are the most ethnically diverse, or rather in the top half of the ethnic diversity graph, were also some of the most racially diverse industries. This includes accommodation and food services, manufacturing, administrative and waste services, and health care and social assistance.
Unfortunately, the industry that is the most racially diverse, and the second most ethnically diverse, is having a difficult time recovering after the initial COVID-19 impacts. Accommodation and food services shed more than half of its jobs in the initial months of COVID-19, and is still down 21 percent from its February employment levels as of October. As restaurant employers in this industry have been able to move part of their operations outside during the warm summer months, this allowed them to increase their patronage and keep staff on payroll. As the colder months of winter roll into Oregon, the harsh weather likely won’t allow restaurant owners to comfortably accommodate outdoor dining. This second blow to the restaurant industry will further hamper the accommodation and food industry’s ability to quickly recover the jobs it shed between March and April.
Another industry that ranks high in its diversity is manufacturing (2nd racially and 4th ethnically). The manufacturing industry shed 8 percent of its jobs at the onset of COVID-19 restrictions, and has only recovered a small fraction of those jobs since then. Still down 7.6 percent from February, the manufacturing industry’s lack of momentum in its recovery has a sizeable impact on the diverse workforce it employs.
Sex
Industry employment among the sexes also differs significantly in Oregon. Women’s COVID-19 experience has differed from that of men’s, and much of that has to do with the industries in which they’re employed at a greater rate than men. Gail Krumenauer, State Employment Economist, covers this piece of diversity and the impacts for each sex in her article “Disparate Impact: COVID-19 Job Losses by Sector and Gender in Oregon.”
The Beauty of the World Lies in the Diversity of its People
Oregon may not be at the top of the list of states with the most diverse workforce. However, it has made progress as decades have passed. In 1999, people of color held only 8.8 percent of total nonfarm employment. In 2019, that share has increased by nearly 5 percentage points to 13.3 percent. With respect to ethnic diversity in employment, Oregon’s share of Hispanic or Latino employment was only 6.4 percent in 1999. As of 2019, that share has almost doubled to 12.4 percent of total nonfarm employment. Diversity – in all its forms – is beneficial for all involved. It enhances creativity, encourages an array of perspectives, and leads to better decision-making and problem solving. People of different backgrounds, cultures, and experiences coming together can be quite a powerful thing in building a more balanced labor force.

Advertisement