Oregon’s Leisure and Hospitality Industry
Leisure and hospitality businesses employed 198,200 workers on average in 2022, up from 162,200 workers in 2020. Of those, roughly one out of nine jobs were in accommodations, slightly less than in arts, entertainment, and recreation where about one in eight leisure and hospitality industry jobs were. About three-fourths of leisure and hospitality workers worked in food services and drinking places. These annual average figures mask how the COVID-19 pandemic has disproportionally impacted this sector of the economy. In spring 2020, mandated closures or curtailments for entire business categories, as well as changing consumer spending patterns in response to the pandemic, resulted in massive job loss in just a short time.
From February 2020 to April 2020 the leisure and hospitality sector shed 52% of payroll employment, compared with a loss of 14% across all Oregon industries. Consumers quickly changed food buying habits under the Stay Home- Save Lives mandated closures, and much of the population was in a hunker-down mentality as the pandemic swept in. Leisure and hospitality had 216,500 jobs in February 2020 and by April 2020 employment fell to 105,000, essentially erasing the industry’s previous 30 years of job gains. Of the 280,900 payroll jobs Oregon lost during that time, 111,500 of those, or nearly 40%, were in the leisure and hospitality sector.
Now about three years into the employment recovery from the depths of the Pandemic Recession, the leisure and hospitality sector has recovered 90.5% of the jobs lost, while overall employment has regained 13,200 more jobs than were lost to the pandemic. Leisure and hospitality is down 10,600 jobs compared with pre-pandemic employment, or about 5% below its peak. There were 205,900 jobs in Oregon’s leisure and hospitality industry in June 2023, or about 10% of Oregon’s total nonfarm payroll employment.
Nationally, data from the Census Bureau’s new Business Trends and Outlook Survey shows the accommodation and food services industry reporting the current conditions index value of 51.7, which is a bit lower than the all-industry average current condition index of 53.6 in July 2023. Despite slightly lagging the all-industry average, the current conditions index in the accommodations and food services industry was lower one year ago, at 44.9, and has shown improvement in the past year. A portion of the index includes responses from businesses asking if current business conditions are below average or poor. The percent of accommodations and food service businesses reporting poor or below current conditions declined from 28.4% for the two-week period ending July 31, 2022 to 23.0% for the similar period ending July 30, 2023.
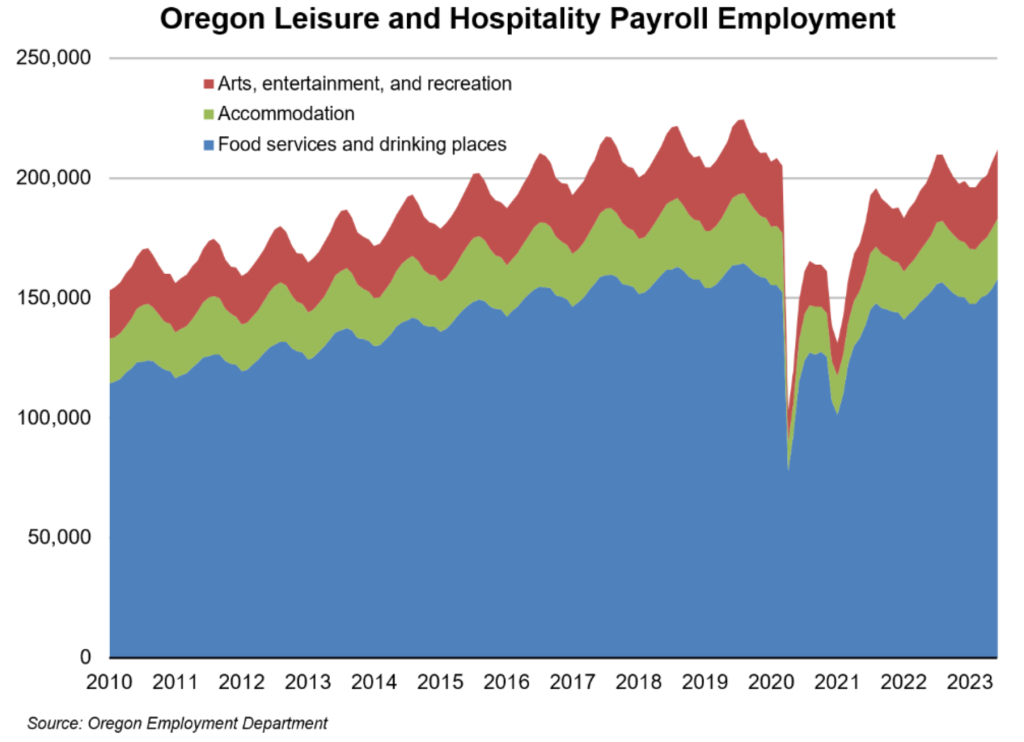
The saw-toothed look on the graph shows the seasonal nature of work in this tourism-related industry, as well as the precipitous declines and recovery seen in the past three years.
During the Great Recession, employment in this industry fell by 6.1% from 2008 to 2010. Oregon’s all-industry employment decline was slightly steeper, with payroll jobs declining by 7.4% from pre-recession peak to trough. By 2018, leisure and hospitality employment rose by 30.1% compared with a gain of 19.3% for total industry employment. As of February 2020, the month before the pandemic hit our economy in earnest, leisure and hospitality was still showing modest over-the-year job growth, rising by 1.8% (+3,800 jobs).
Over the most recent 12 months ending in June 2023, the arts, entertainment, and recreation industry gained 2,500 jobs or a gain of 9.5%. Accommodations added 1,500 job, an increase of 6.3%. Food services and drinking places employment increased by 5,300 jobs statewide, a gain of 3.5%. Within the food services component, the gain was uneven with full-service eating places up by 4,200 jobs or 6.4% and limited-service eating places down 1,500 jobs, a decline of 2.1%. Full-service restaurant employment fell more sharply early in the pandemic than limited-service establishments.
One blessing in disguise occurred during the pandemic when the Almeda, Obenchain, and Slater fires hit Southern Oregon. Many of those who were evacuated or lost homes were able to find temporary or long-term shelter in the area’s hotels and other lodging places. Had it been a normal non-pandemic summer near the peak of tourist season, it is likely that many of those hotels would have been filled with usual summer travelers.
Connection to Tourism
We often think of leisure and hospitality as a tourism industry. While many jobs in this industry are reliant upon tourism, local spending also plays a significant role. The Oregon Tourism Commission contracts Dean Runyan Associates to produce travel spending impact analysis for Oregon. According to their Oregon Travel Impacts 1991- 2022 report’s preliminary estimates, travel spending generated 75,420 direct jobs in the accommodation and food services sector in 2019 and fell to 58,440 in 2020. In 2019 there were 20,600 direct jobs in the arts, entertainment, and recreation sector, which fell to 16,300 in 2020.
By 2022, travel generated employment had recovered and slightly exceeded pre-pandemic recession totals with 76,050 direct travel jobs in accommodations and food services, and 20,480 arts, entertainment, and recreation travel industry employment jobs. Combined, these jobs made up about 82% of total direct travel-generated employment that year. Retail and wholesale trade, professional and business services, and transportation were other industries that had direct travel-generated employment in Oregon. While tourism is undoubtedly critical to the growth and success of many leisure and hospitality jobs, there are likely even more that depend upon local business and customers. Dean Runyan Associates’ most recent visitor volume and travel impact report can be found at: Oregon Travel Impacts: 2003 – 2022, Dean Runyan Associates – Travel Oregon.
Leisure and Hospitality’s Sales and Share of Oregon’s Gross Domestic Product
According to the 2017 Economic Census, sales in Oregon’s accommodation and food services industry totaled $11.8 billion among 9,261 firms. Five years earlier, total sales in Oregon were just under $8.5 billion. The arts, entertainment, and recreation industry had $1.7 billion in sales among 1,362 Oregon firms in 2017. The Economic Census is only conducted every five years.
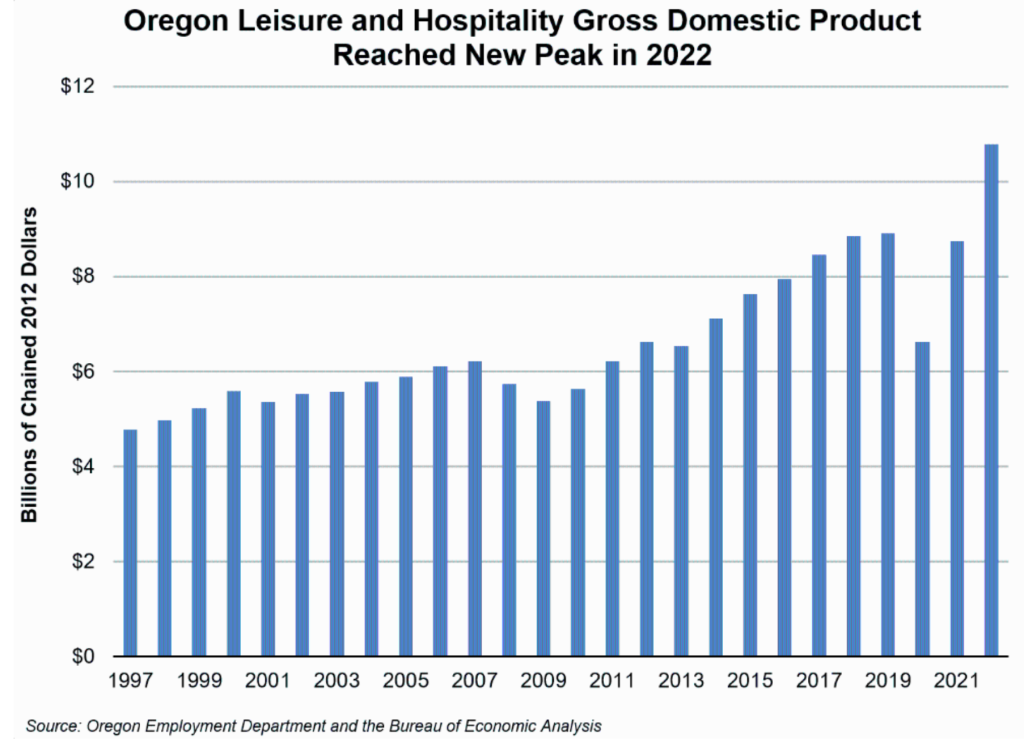
Oregon’s gross domestic product (GDP), the estimated value of all goods and services produced in the economy, is also estimated for the leisure and hospitality sector. The Great Recession drove leisure and hospitality industry GDP down 10% between 2007 and 2009. The industry fully recovered by 2012, with GDP totals above the pre-recession level and continuing to grow until 2019 when about $8.8 billion was generated in Oregon’s economy. Total leisure and hospitality GDP plunged to $6.63 billion in 2020, before rebounding nearly to the pre-pandemic level to reach almost $8.75 billion on 2021. In 2022, Oregon’s leisure and hospitality gross domestic product was $10.79 billion according to the Bureau of Economic Analysis.
With the growth in recent years, the relative share that leisure and hospitality contributes to Oregon’s overall economy has varied from about 4.0% of total GDP in 1997 to about 3.3% during the Great Recession in 2008-2010. In 2020, leisure and hospitality’s share of Oregon’s GDP fell to 3.1% and recovered slightly to 3.8% in 2021. In 2022 leisure hospitality industry comprised 4.6% of Oregon’s total GDP, a peak for the series going back to 1997.
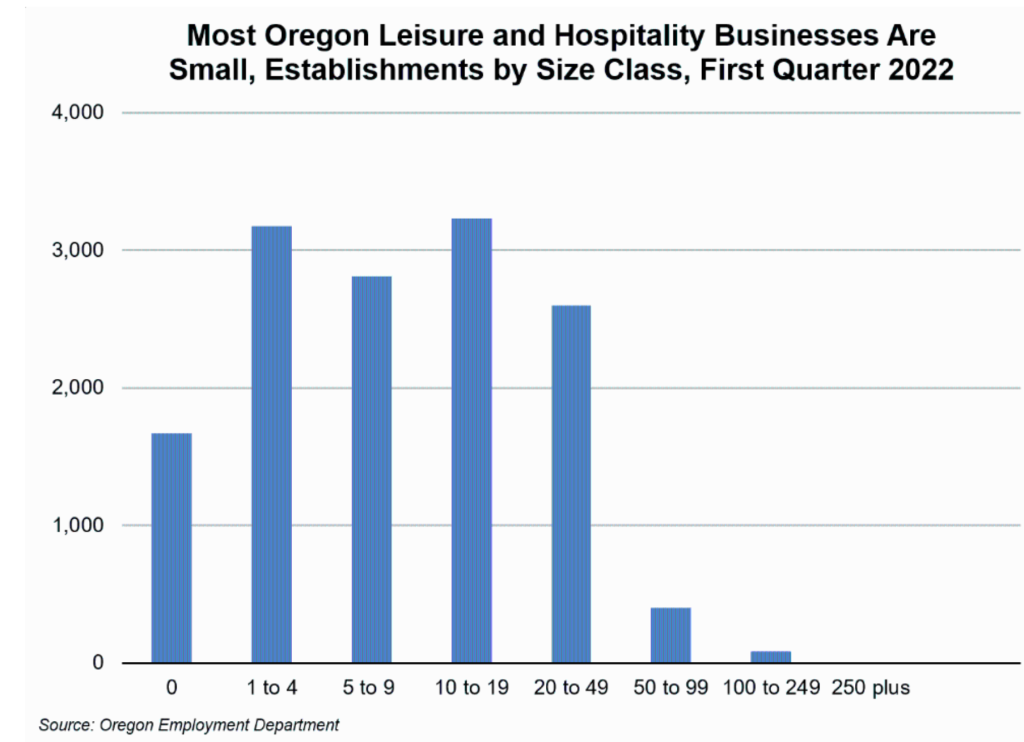
Most Oregon Leisure and Hospitality Establishments Are Small
In Oregon, there were just 90 leisure and hospitality establishments that had 100 or more workers at the beginning of 2022. Size of establishment data are published for only the first quarter of each year, typically the slowest season for leisure and hospitality, so that may skew these values. An establishment may have no paid employees during the slowest winter months, and then bring on seasonal workers during the busier summer months. The greatest number of establishments had between one and four workers, and slightly fewer employed between 10 and 19 workers. Of Oregon’s 188,083 leisure and hospitality jobs in March 2022, 119,670 were in establishments with 10 to 49 workers.
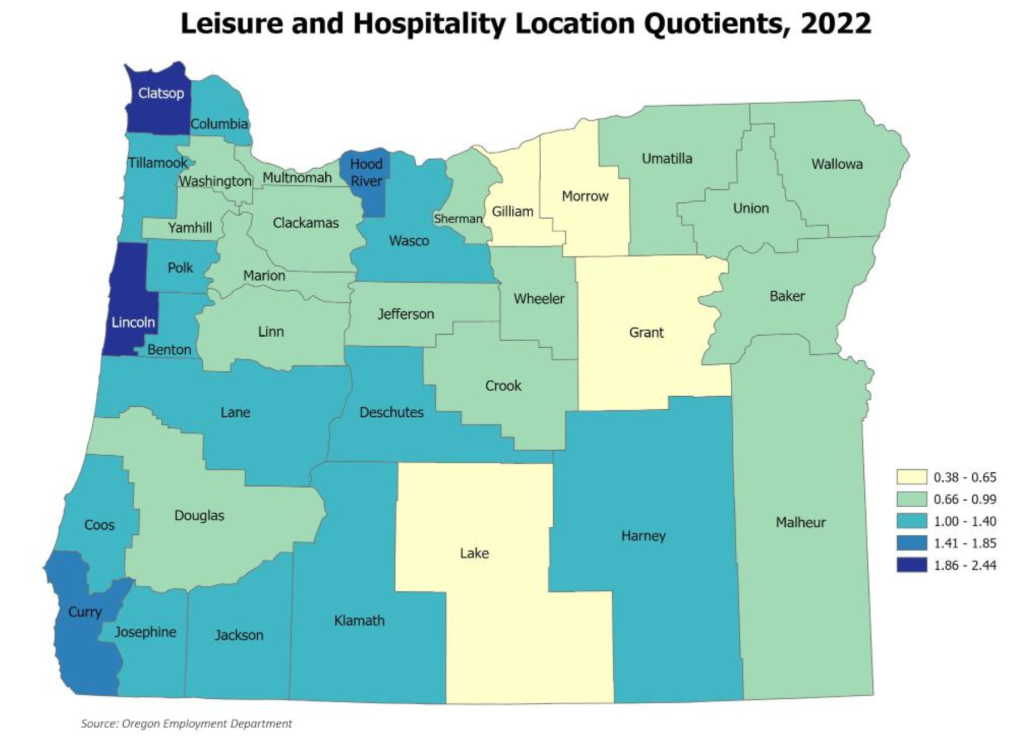
Coast Most Dependent on Leisure and Hospitality
The coastal counties Clatsop, Lincoln, and Curry are the most leisure and hospitality dependent in Oregon, with more than twice the share of employment as in Oregon statewide. Other counties including Coos, Deschutes, Tillamook, and Hood River counties also have a strong concentration of leisure and hospitality jobs.
The map displays the location quotients for the leisure and hospitality industry within Oregon. Location quotients are a measure of industry employment concentration. If a county has a location quotient of 1.0 that means its share of leisure and hospitality jobs compared with the all-industry total is the same share of employment in that industry as the statewide total. Oregon as a whole has a very similar concentration of leisure and hospitality jobs to the United States. Tourism hot spot counties such as Hood River and Deschutes have strong leisure and hospitality location quotients.
Conclusion
While below the pre-pandemic total, nearly 200,000 jobs can be found across Oregon’s nearly 14,000 leisure and hospitality establishments. As the economy continues to recover from the pandemic, we can hope that this industry recovers as well. Many Oregonians, including myself, started their careers working in restaurants. Those skills, such as getting along with coworkers, providing quality customer service and countless more, are essential and transfer to many other industries and jobs. Recovery from the pandemic and continued population growth will bring many opportunities to apply those skills, in Oregon’s leisure and hospitality businesses and beyond.
by Guy Tauer
Regional Economist
Coos, Curry, Jackson, and Josephine counties
https://www.qualityinfo.org/-/oregon-s-leisure-and-hospitality-industry-1

Advertisement