Oregon’s 2020 Natural Population Increase Was the Lowest on Record
 By Sarah Cunningham
 Employment Economist
 sarah.e.cunningham@oregon.gov
In 2020, Oregon’s population increased by 31,655 to 4,268,055. This marked growth of 0.7% over the year and growth of 11.4% since the 2010 Census. Portland State University’s Population Research Center recently released more detailed information on why this population growth has occurred.
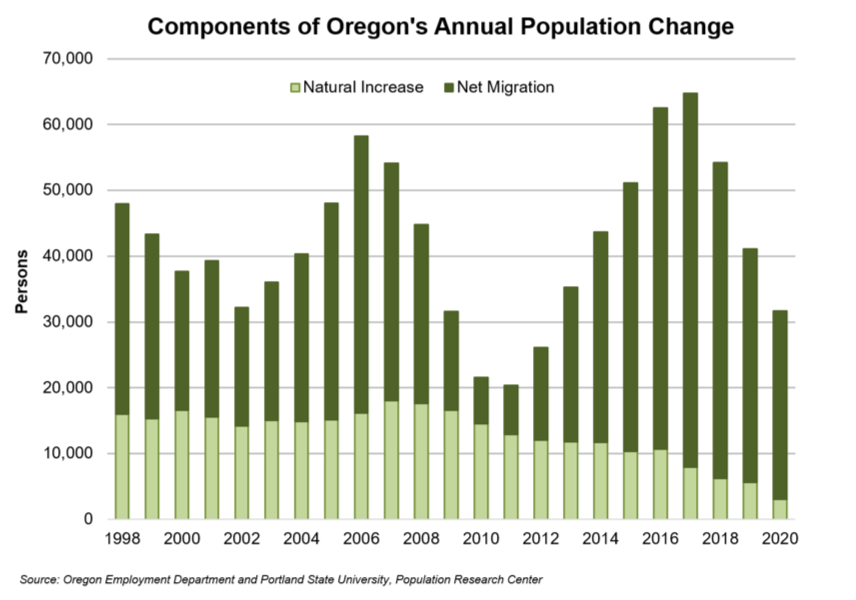
There are two main reasons that lead to population change. First, an area increases in population if more births than deaths occur in a given year or vice versa. Second, population can increase or decrease through net migration. That is, over the year, people either move into or out of an area. A positive value of net migration means more people moving into an area than leaving it, while a negative value of net migration indicates more people leaving an area than moving in.
In 2020, natural increase contributed 3,100 to population growth, which was the lowest since comparable records began in 1960. The low natural increase is caused by an increase in the number of deaths (37,800), which was the highest total since 1960. In 2018 and 2019, there were 36,600 deaths in Oregon each year. Since 2011, Oregon had a relatively low natural increase compared with the prior four decades.
Oregon Continues to Attract Migrants
With 28,600 net migrants, 90% of Oregon’s population increase in 2020 was due to net migration. Over the past 20 years, Oregon had an average net migration of 29,300 people per year. The lowest number of net migrants over the last 20 years was 7,000 in 2010. In general, we see net migrants increase as the economy expands and more jobs become available. Notice that prior to the Great Recession, net migration was booming in Oregon. As the recession hit, people became less mobile. This, combined with Oregon experiencing a deeper recession than the nation as a whole, brought net migration to its lowest levels since the 1980s. In the most recent economic expansion, net migration peaked in 2017 at 56,800 before beginning to decline in 2018, likely driven by a slower-growing economy and ongoing housing availability and affordability. The current economic crisis driven by public health restrictions related to the COVID-19 pandemic likely contributed to continued declines in 2020. There were 20% fewer net in-migrants in 2020 than in 2019. For more on the link between migration and economic growth, visit Damon Runberg’s article Migration in Oregon Before the Days of COVID.
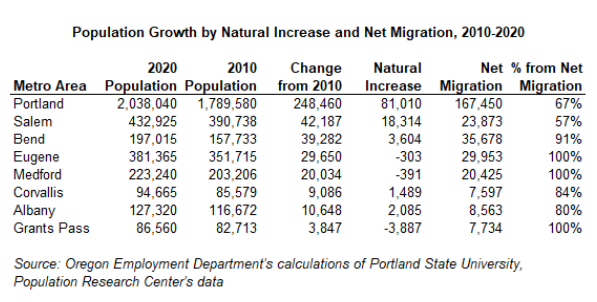
Metro Areas Gain Most from Net Migration
From 2010 to 2020, Oregon’s net migration gain was 340,100, which made up more than three-quarters (78%) of the population gain. Revised natural increase and net migration by county data from Portland State University’s Population Research Center show the net migration gain in metro areas of the state was 301,300, which accounted for 89% of total net migration gains in the state. Since 84% of Oregonians live in a metro area, this gain suggests the share of Oregonians living in metro areas is increasing.
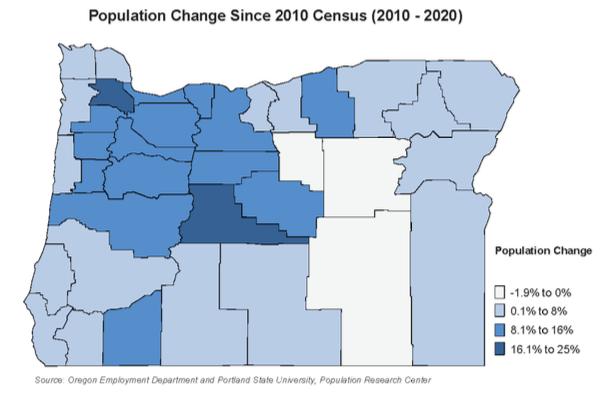
While metro areas in Oregon grew 12.7% between 2010 and 2020, rural areas grew only 5.2%. In some cases, counties saw a decline in population. Declines can occur due to losses through both natural decrease and net migration, or one of the two factors outweighing the other.
Two counties in Oregon lost population between 2010 and 2020: Harney and Grant, losing 1.9% and 1.7% of population, respectively. Both counties experienced a natural decrease in population. Harney County also had negative net migration, but Grant experienced positive net migration. Wheeler County had a negligible population decrease of one person.
Sixteen counties in Oregon had a natural decrease in population between 2010 and 2020. In addition to the two counties that lost population, Douglas, Josephine, Coos, Curry, Lincoln, Tillamook, Baker, Crook, Jackson, Lane, Wallowa, Lake, Wasco, and Wheeler had more deaths than births between 2010 and 2020. Gilliam and Sherman had a negligible natural decrease in population between 2010 and 2020.
These 16 counties that experienced a natural decrease in population were home to 33% of Oregon’s 65-and-over population in 2020. But, these counties only made up 25% of Oregon’s entire population. The average share of the population 65 and over in these 16 counties was 25% compared with the 19% share for the state as a whole. The disproportionate share of people 65 and over in the 16 counties was a major factor in their natural population decrease.
Population Estimates by Age and Sex
The Population Research Center at Portland State University prepares annual population estimates for Oregon and its counties by age and sex, and incorporated cities and towns as of July 1 each year. These estimates serve as the official population numbers between each decennial Census, and are used to disburse state revenues to Oregon counties and cities.
To explore and use population estimates data for 2020 and prior years for Oregon and its counties, visit https://www.pdx.edu/population-research/population-estimate-reports.

Advertisement