Manufacturing in the Rogue Valley
Manufacturing employed 186,367 Oregonians in 2021, which is about 12% of total private payroll coverage at the statewide level. Zooming in on the sector within the Rogue Valley, manufacturing employed 10,575 Southern Oregonians in 2021, which is about 10% of total private coverage within the Rogue Valley. The manufacturing sector in Southern Oregon umbrellas an eclectic blend of firms that produce different goods such as wood, food and beverages, transportation equipment, plastics, metals, computers and electronics, and furniture. More information on the employment and wages of the specific industries within manufacturing in Jackson County or Josephine County can be found at the Employment Department’s research website QualityInfo.org.
Current Employment
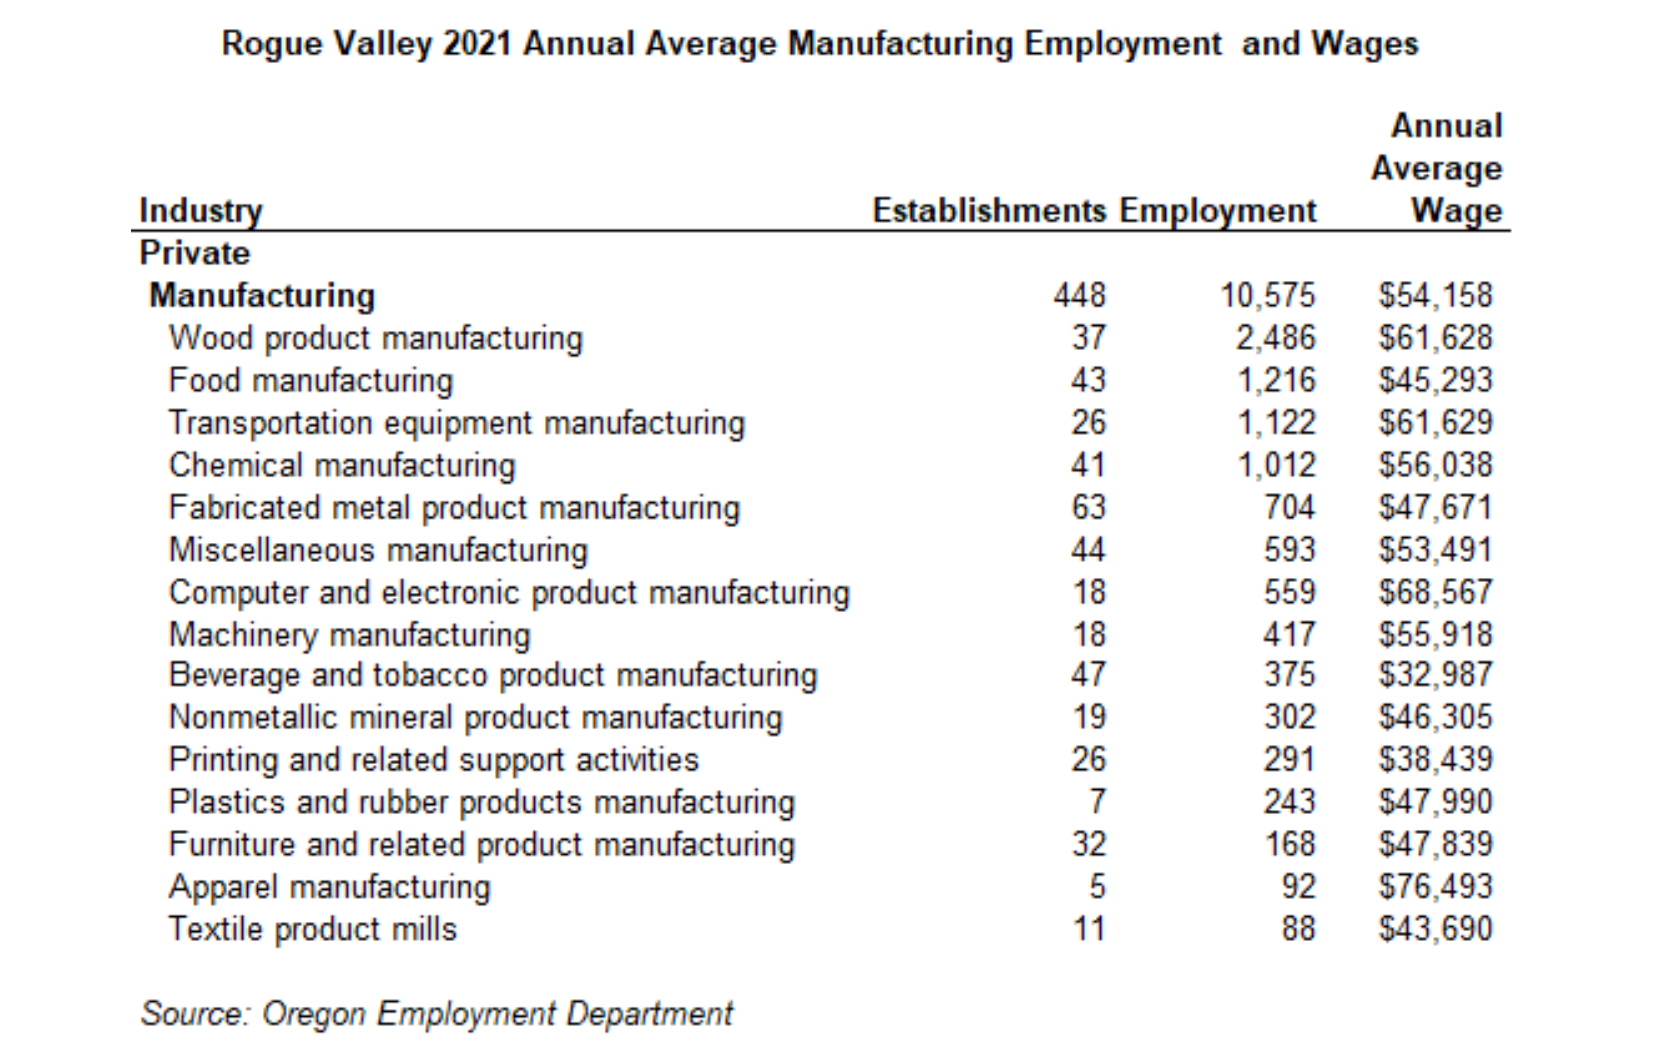
Jackson County manufacturing encompassed 337 establishments in 2021 which employed 7,643 workers. This makes up about 10% of the private sector for the Medford MSA. Josephine County manufacturing had 111 establishments in 2021 which employed 2,932 workers. This makes up about 11% of overall private employment for the Grants Pass MSA. Manufacturing jobs hold similar roles in terms of overall employment share between the Rogue Valley sister counties.
Manufacturing can be further broken down by the different industries that are also listed in the table above. Wood production held the largest share of manufacturing employment in the Rogue Valley, with 2,486 workers or 24% of employment. Food manufacturing followed, with 1,216 workers or 12% of employment. Transportation equipment manufacturing and chemical manufacturing each held another 10% of industry employment. Fabricated metal production had the largest share of establishments (63) within manufacturing but only 7% of the industry employment.
Industry Specialization: Location Quotients
One more tool available at our disposal to better understand a region’s industries and their significance are Location Quotients (LQ). LQs are employment ratios that compare a specific industry’s share of jobs in the local region relative to its share of jobs in the nation. If an LQ is near or equal to 1, the industry make up resembles the nation’s and can imply local production meets local demand. If an LQ is greater than 1.25 it indicates a degree of specialization in that industry and can also create exporting opportunities, while an LQ less than 0.8 indicates the share of employment in that industry is less than the national share. In terms of the accompanying graph, the bigger the bubble size, the more prevalent that industry is to its local economy. Location quotients are a valuable tool we can use to identify key industries within local economies since those industries with larger LQ’s tend to contribute to a regional economy’s overall growth prospects.
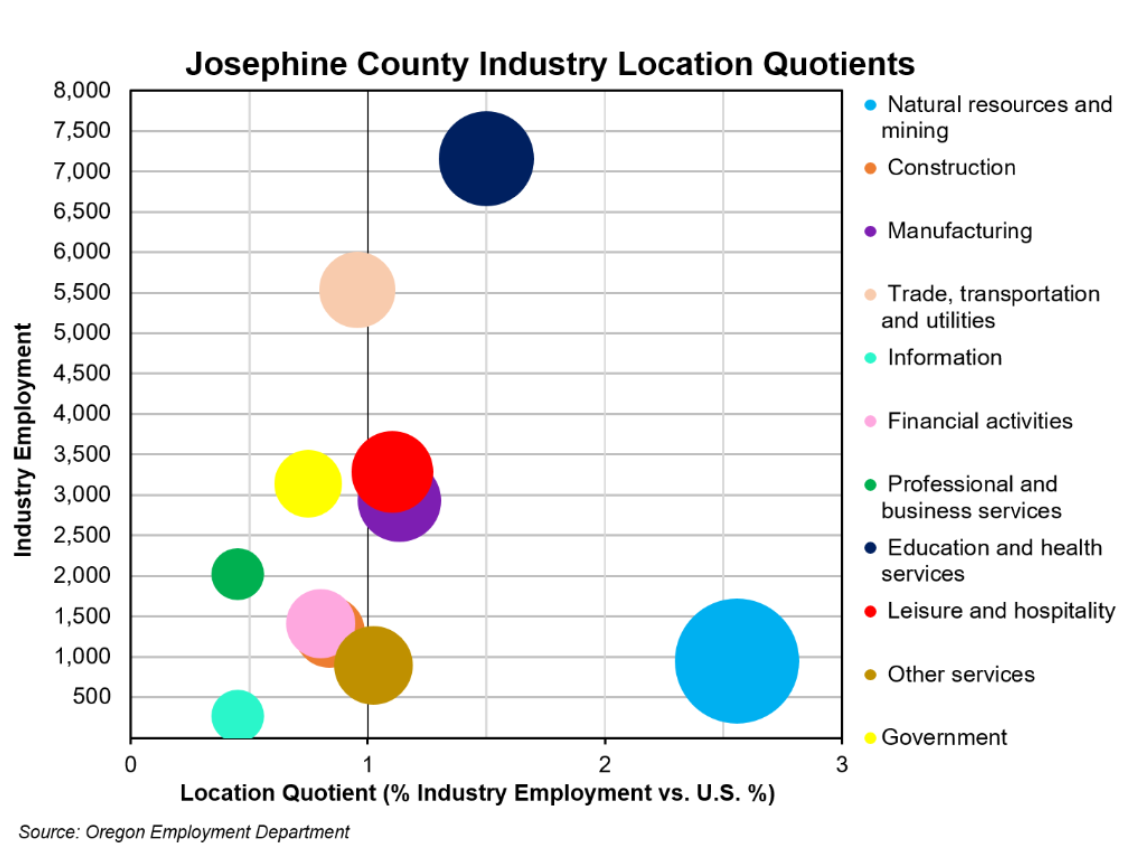
Manufacturing, the purple bubble above, had an LQ of 1.13 for Josephine County. We can interpret that by saying, jobs in manufacturing were 1.13 times more concentrated in Josephine County than in the U.S. as a whole in 2021.
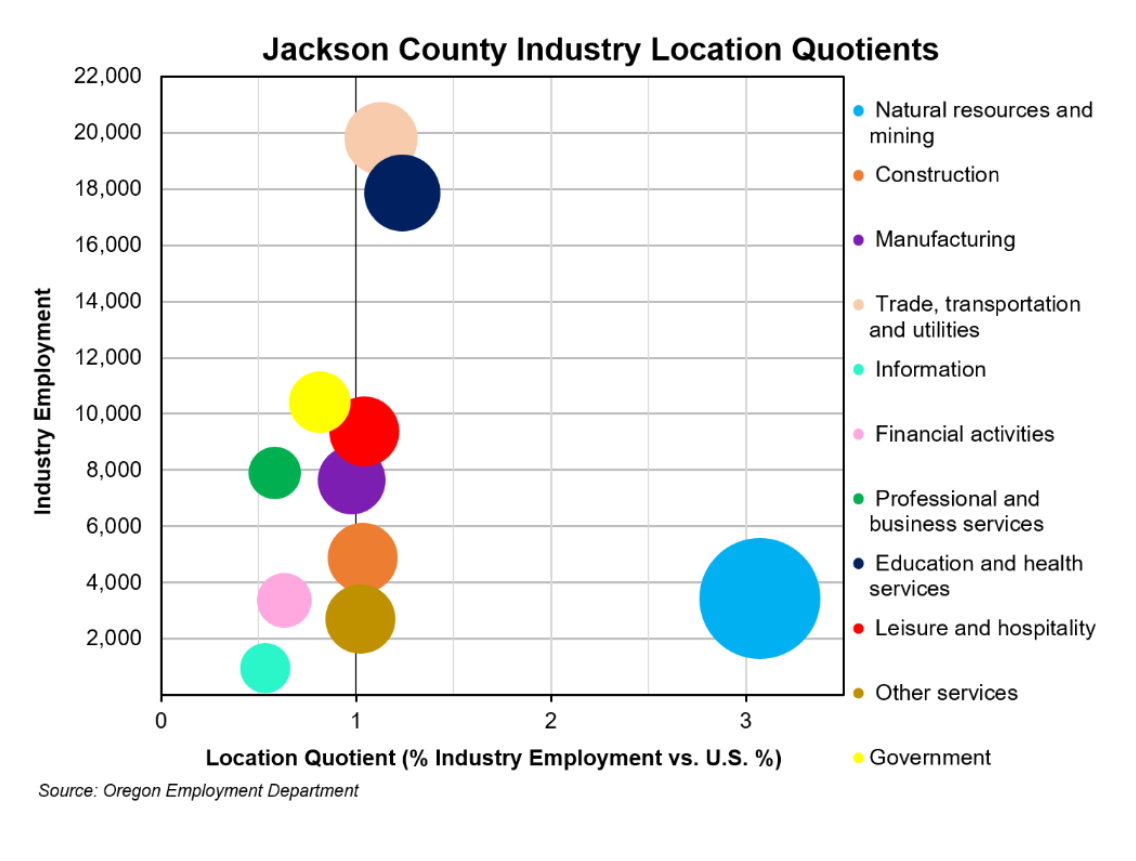
Production jobs appear to be slightly less concentrated in Jackson County than Josephine County. Manufacturing had an LQ of 0.98 for Jackson County. We can interpret that by saying, jobs in manufacturing have about the same concentration in Jackson County as in the U.S. as a whole in 2021.
Employment Trends
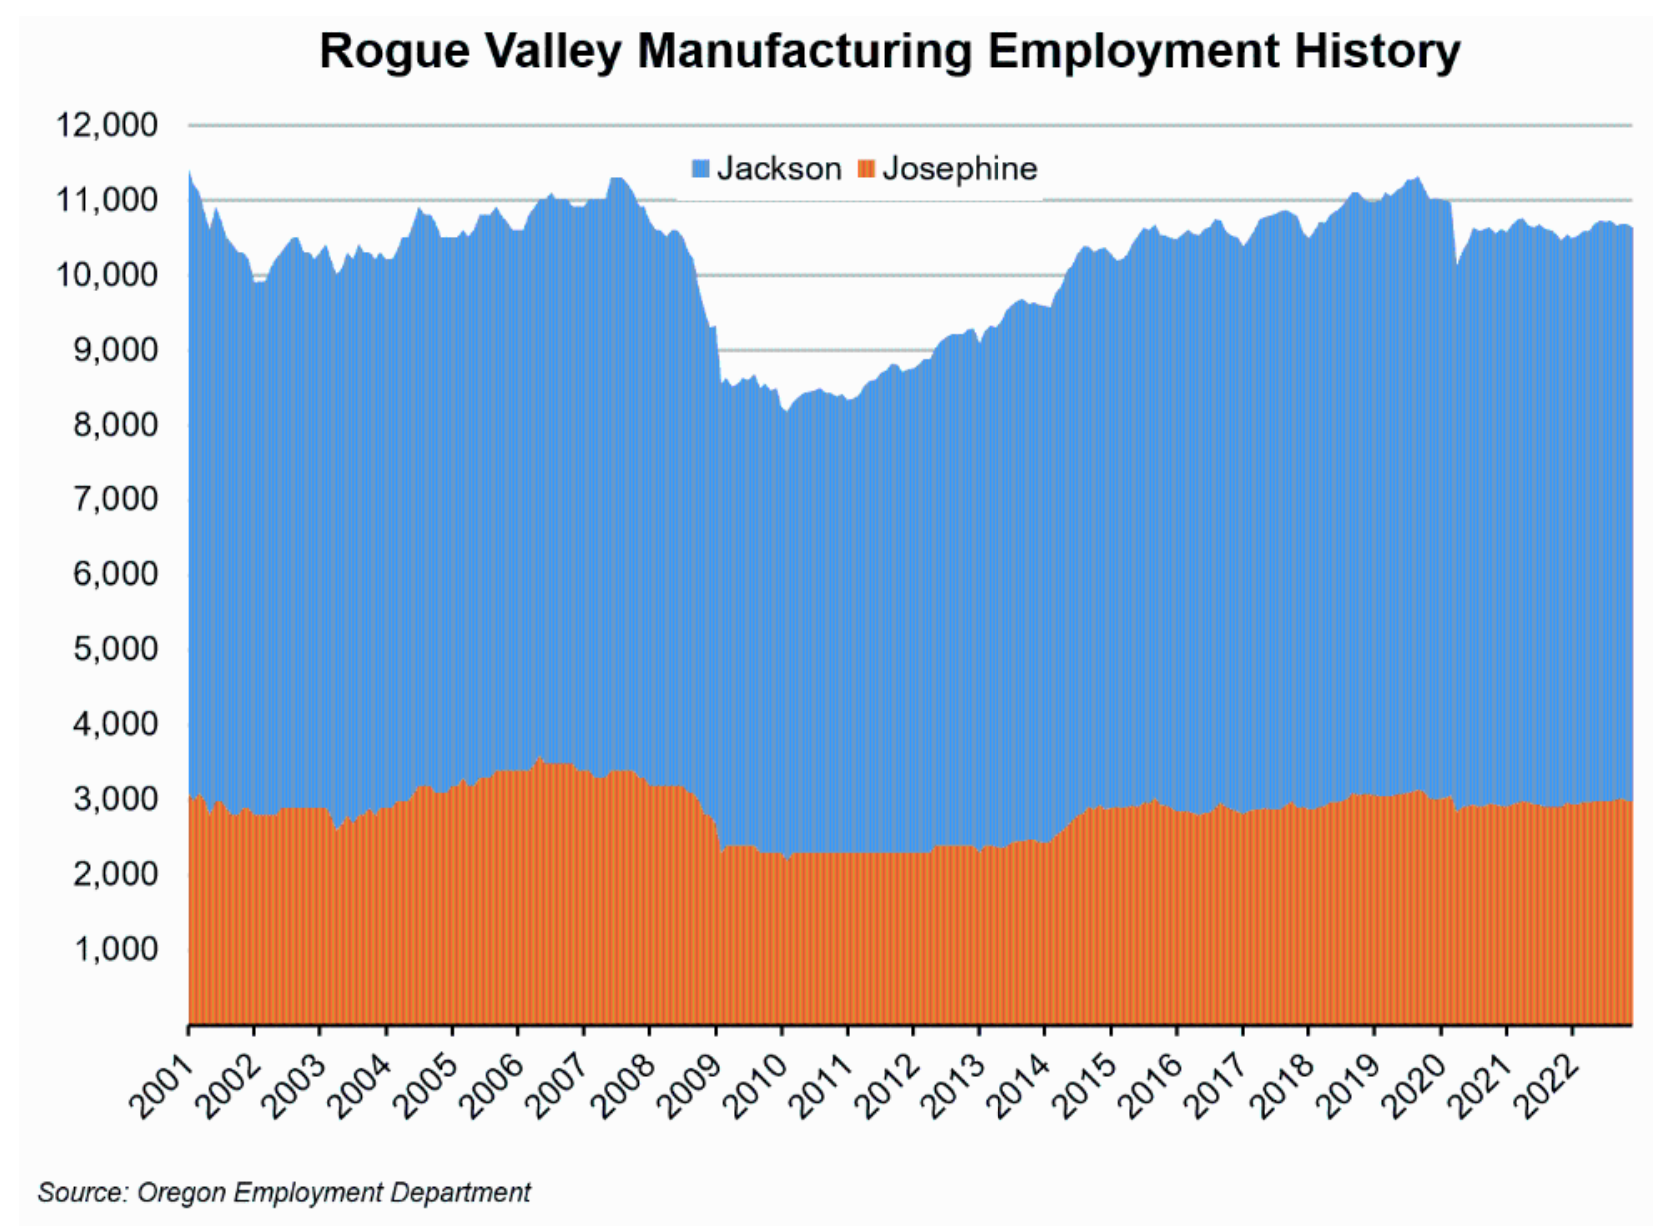
Manufacturing employment levels have remained steady since 2001, mainly declining only during economic recessions. The period from 2001 to 2008 was relatively stagnant for the overall sector, shedding 430 jobs (-4%) over the eight years leading up to the Great Recession. While the economic contraction was felt more in financial industries, manufacturing saw a decrease of 1,160 jobs (-16%) from 2008 to 2009. The recovery after the initial blow to production was slow but steady, and from 2010 to 2014 manufacturing in the Rogue Valley grew at an annual average rate of 3.2% until it regained the pre-Great Recession employment level in 2015.
The relative resilience of this industry is truly an asset to Southern Oregon that the rest of the state doesn’t have. For example, manufacturing at the statewide level shed 27,413 (-12.4%) from 2001 to 2022 compared with the Rogue Valley’s loss of just 61 jobs (-0.57%) over the same period.
Pandemic Implications
From 2015 to 2019 the Rogue Valley added 670 manufacturing jobs (+6.4%) leading up to the most recent recession in 2020. The COVID-19 recession introduced great turmoil to the whole economy and brought with it an economic lockdown. Occupations without the capability to work socially distanced were forced to shut down overnight. At the statewide level, from March to April 2020 Oregon’s total private payroll shed 238,400 jobs (-17%). Other industries that had the luxury of working within socially distanced guidelines experienced a much lighter employment layoff. Manufacturing in the Rogue Valley lost 870 jobs (-7.9%) from March to April 2020. As the local economy tip toes into post-COVID territory, Rogue Valley manufacturing has struggled to regain its pre-pandemic employment levels as it hovers at 10,575 jobs.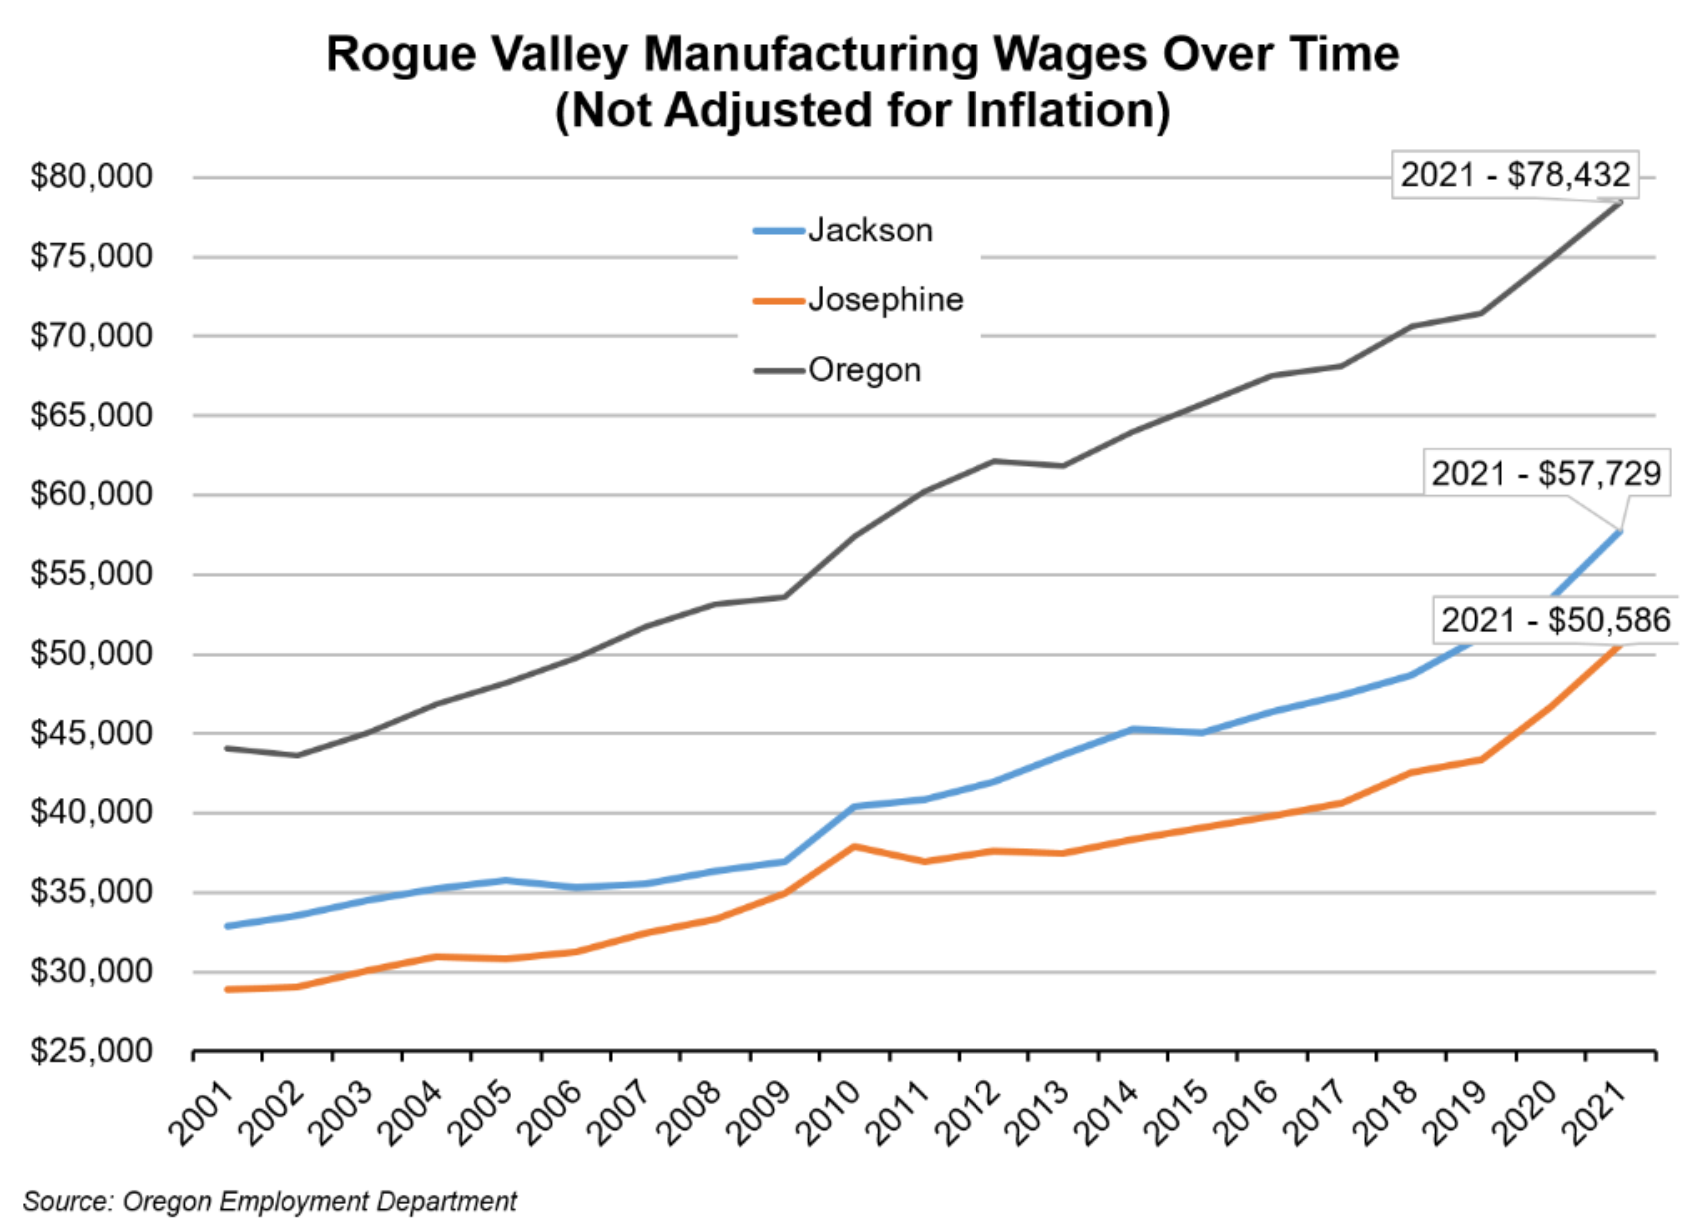
Production Wages
Manufacturing wages tend to be lower in the Rogue Valley than the statewide level and wages in Josephine County tend to be lower than those in Jackson. Although employment hasn’t seen continuous growth, manufacturing wages have been steadily rising for both the Rogue Valley and the state. The fastest growth has been seen shortly after economic contractions. Following the 2007 financial crisis, manufacturing wages for the Rogue Valley increased on average by $5,134 (+15.2%) from 2007 to 2010. Coming out of the pandemic recession, production wages increased for the Rogue Valley on average by $6,947 (+14.9%). The wage information used in the graph above has not been adjusted for inflation and includes nominal wages.
Differences in the Manufacturing Type Determine Wages
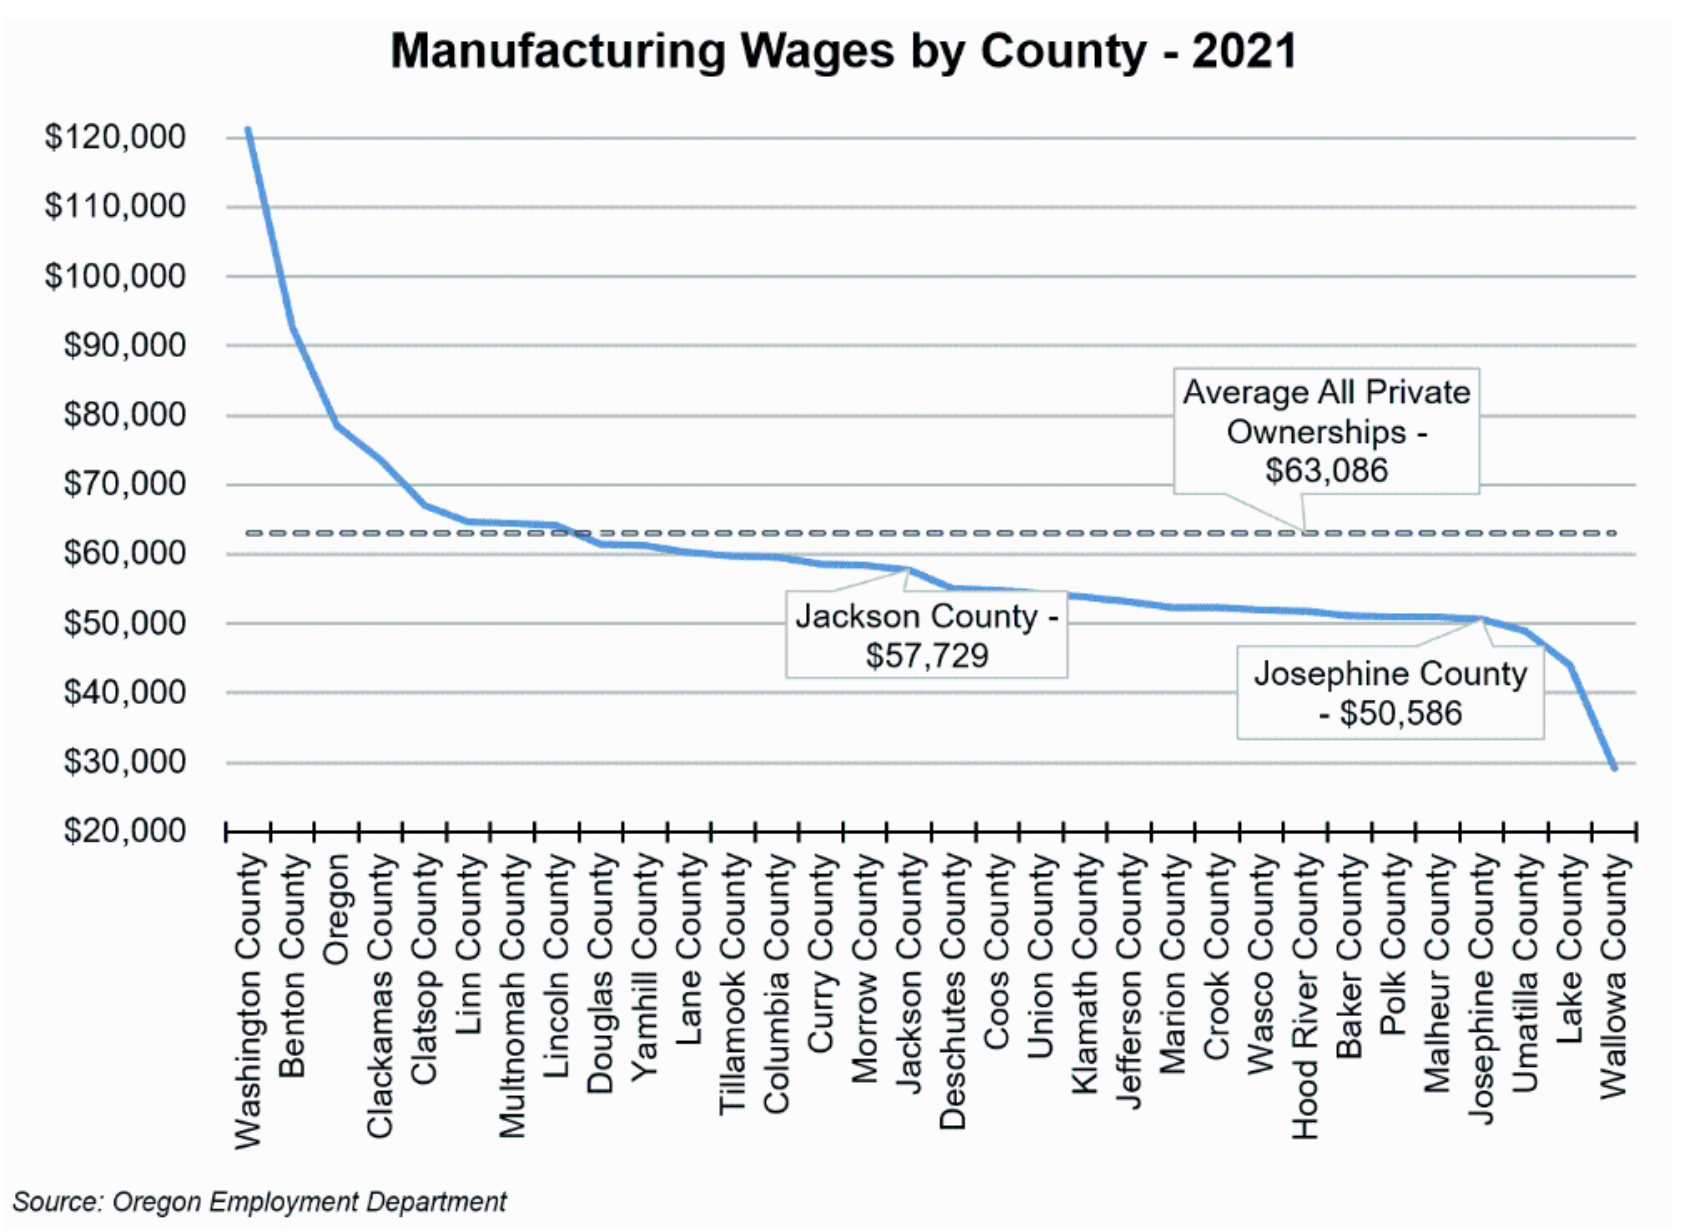
There are over a hundred different manufacturing industries throughout Oregon. For example, animal food manufacturing, breweries, footwear manufacturing, asphalt manufacturing, plastic pipe manufacturing, metal tank manufacturing, semiconductor manufacturing, and medical equipment manufacturing – to name a few. A list of every single type of manufacturing that Oregon produces in addition to the employment and wage of each be found following this link to QualityInfo.org. Areas with a high proportion of employment in the higher-paying manufacturing industries will have relatively higher average wages while those that have a high proportion of employment in industries such as beverage and tobacco, textile mills, food, and printing manufacturing will have relatively lower wages.
In addition, using the “Detailed Industry Report tool”, you can also select specific subsectors to compare employment and wages of different counties in a type of manufacturing, such as the following report: food manufacturing in Jackson County – 2001 to 2022.
Outlook
According to the latest industry employment projections, manufacturing in the Rogue Valley is expected to add 720 jobs from 2021 to 2031, or on average about 72 jobs annually until 2031. The bulk of the projected jobs are in durable goods manufacturing (+490 jobs) and in wood product manufacturing (+140 jobs). Zooming into production occupations, projections anticipate 8,071 openings specifically due to replacements from 2021 to 2031. Replacement openings are where newly trained workers are needed to fill openings left by workers who retired, otherwise left the labor force, or made a major occupation change. The majority of openings are due to replacement. A granular look at more than 75 different production occupations that have projection data for the Rogue Valley can be found here under “Employment Projections Data à Rogue Valley Occupational Employment Projections 2021-2031.”
By Press Release
State of Oregon Employment Department
https://www.qualityinfo.org/-/manufacturing-in-the-rogue-valley?redirect=%2Frogue-valley

Advertisement