HOW COVID IS CHANGING OUR BUYING HABITS
By Josh Lehner,
Oregon Office of Economic Analysis

OK, this was fun. Willamette Week is out with a set of articles highlighting some of the sectors of the economy that are doing quite well this year, despite the pandemic and recession. My hat’s off the Aaron Mesh and company for their ability to turn my spreadsheet of figures into coherent, local stories. But in general, I appreciated the request about which sectors are doing well because it allowed me to clarify my thoughts and better think through some of the changes we have seen so far this year. Last month we posted a chart showing industries that have seen job growth this year and noted a lot of them are related to e-commerce and the housing market. We fleshed out the discussion a bit further in our latest forecast document, but today I wanted to really dive into the figures a bit.
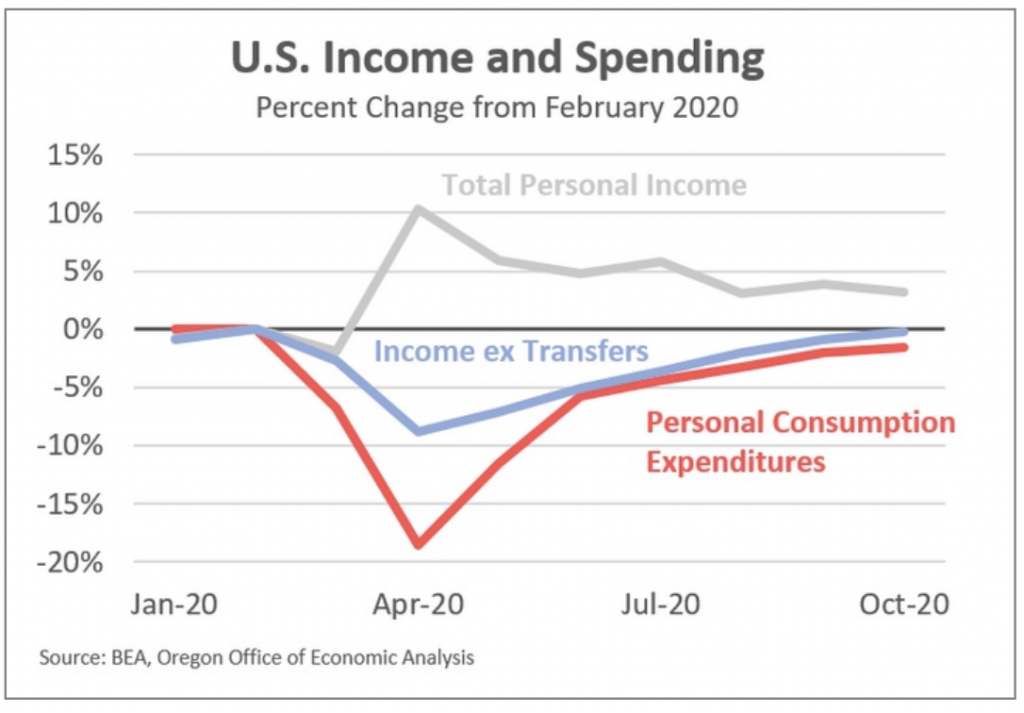
First, the main reason consumer spending has held up relatively well this year is the fact that incomes have. In fact incomes for the majority of households are flat, or up, allowing us to continue to buy things. The top line in the chart below shows total income across the country (we get 2020q3 Oregon data in a couple weeks). The main reason it is higher is due to the one-time recovery rebates back in the spring, plus the expanded unemployment insurance benefits. However even if we exclude the federal support, incomes in October were essentially back to where they were prior to the pandemic (-0.17%). Total consumer spending has rebounded accordingly. The fact that spending is still a bit weaker than incomes, means household savings is growing. Latest figures indicate Americans have saved nearly $1.5 trillion extra so far this year. That savings is literally just sitting in bank accounts at the moment and will be a key source growth next year, when the pandemic wanes.
What has changed, however, are the things we are buying. We are no longer going out to eat, to the movies, on vacations, getting hair cuts or our nails done like we used to. These activities were highly visible parts of what we did on a regular basis and today we are not doing them much. We can certainly feel this, and notice these activities are missing in our lives. But what it also did was free up a lot of money to spend on anything and everything else that doesn’t require a lot of in-person interaction. Mostly, this means physical goods we can order online. Many of these things help spruce up our apartments and homes where we are spending more time, or help pass that time at home.
In the chart below the bubbles shows different categories of consumer spending. On the x-axis going left and right, is growth in these categories in recent years prior to the pandemic. This is sort of the baseline of what one would expect sales in 2020 to look like absent COVID. On the y-axis going up and down is growth over the past 12 months. Nearly everything above the horizontal 0% line isn’t just up over the past year, but it’s up even more than pre-COVID expectations would indicate. Sales of everything below the horizontal 0% are down.
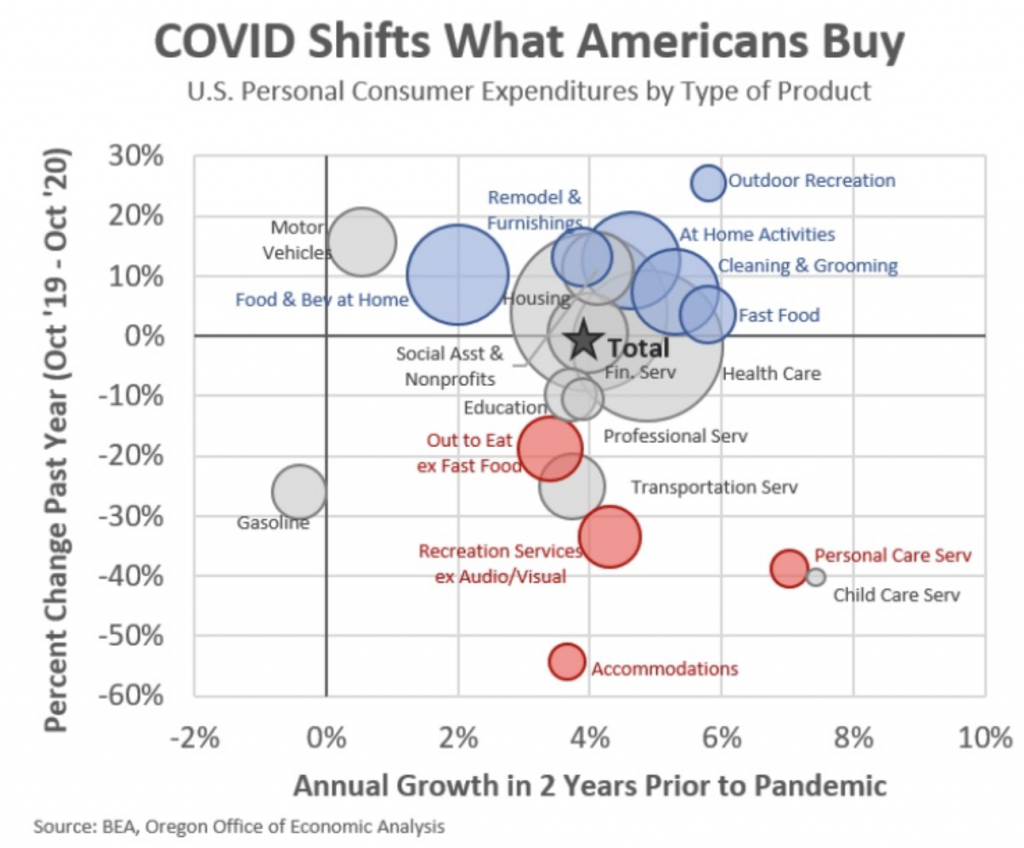
A few notes on some of these categories:
In terms of food, we are clearing going out to eat a lot less. This means grocery sales are up as we cook at home more. Interestingly enough sales of vegetables, meat, dairy, etc are up the most while sugar and sweets are up the least. This points to us really cooking at home and not just buying more junk food to keep us company. Even so, pandemic fatigue has set in. We are not cooking at home quite as much as we did back in the spring. In the past handful of months, we have begun going out to eat more, even if it’s primarily takeout, and fast food, which is now positive on a year-over-year basis.
Activities at home primarily include things that help us enjoy our time indoors more and include audio/visual equipment, computers, TVs, internet and streaming services, but also sewing, magazines, books, musical instruments, and games, toys, and hobbies.
Remodel and furnishings include furniture, carpet, windows, appliances, dishes, glassware, tools, gardening supplies, and plants. I suspect some of this is we are sitting around more at home and notice things that could be upgraded, or projects we’ve been meaning to get around to but now have the time to do so.
Outdoor recreation includes sporting equipment, camping equipment, RVs, boats, bikes and the like. As we move into winter this will include skis, snowmobiles, sleds, and so forth. The demand here is up likely due to being spaced further apart outside is less of a risk and is something fun to do.
If we’re spending more time at home that means we are also cleaning and grooming more at home. Sales of household cleaning products, toilet paper, and personal care products like shampoo, shaving-related items are up, as are pharmaceuticals both prescription and over the counter medicines.
Now, one type of spending where sales are not up includes clothes and shoes (not shown on the chart). I suspect some of this is because we like to try these on in the store. Online returns, however seamless, still require some effort and waiting a few days. Clothes and shoe sales may also be down because we are missing out on special events where we buy a new shirt, a new dress or the like. This may include weddings, holidays, school events, and even traditional back to school shopping. Such activities are fewer in number this year, or at least the gatherings are smaller in size.
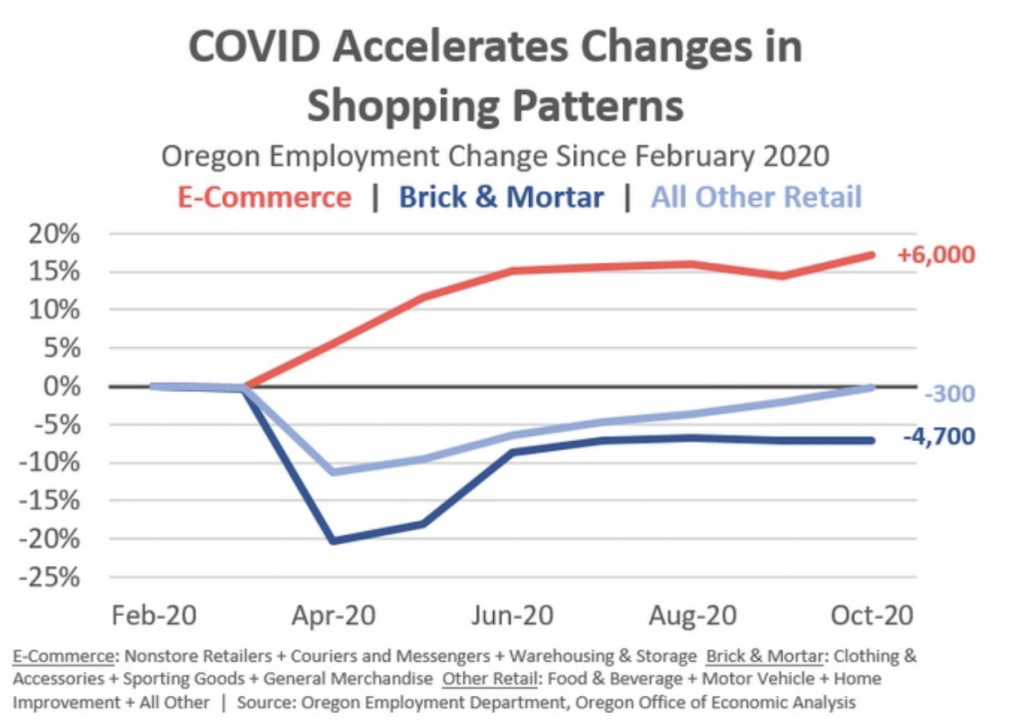
Finally, the pandemic appears to have accelerated the growth in e-commerce at the expense of traditional brick and mortar. Of course this has been going on for a long time, but the shifts so far this year are larger than we have seen before, likely because we try not to venture out as much and are stuck inside, browsing the internet to a higher degree.
As such, these online sales do translate into more jobs related to moving, storing, and delivering the products. Since the start of the pandemic, Oregon e-commerce and related jobs are up 6,000, while brick and mortar retailers are down nearly 5,000 jobs, which even includes the growth at warehouse clubs. The e-commerce employment data is confirmed by growth in weight-mile taxes paid by truckers moving products into and across Oregon. Overall, these sectors are expected to grow in the years ahead. That said, e-commerce’s share of overall retail sales will drop in the year ahead when consumers feel confident again going out shopping like they used to. However, long-term trends all point toward sustained, future growth in e-commerce sales. In fact, many of the new business applications nationwide are for firms looking to focus on online sales.
All told, given incomes have largely held up so far this year, consumer spending has as well. We are clearly missing many of our normal social activities, and our spending has largely revolved around finding other ways to enjoy pass the time during the pandemic. I do believe there is strong pent-up demand for going out to eat, to the movies, on vacations, to the salon and the like. Of course this demand will not fully return until it is safe to do so. But when it is safe — and vaccines start in a matter of days, although it will be months before most of us get them — we will see a big shift back into these in-person activities. This shift will be pro-growth and pro-jobs. Even as spending on physical goods reverts back to trend, or below it for a period of time, there is unlikely to be a major impact on jobs as much of the growth is in warehousing and delivery, which were already long-run growth sectors.

Advertisement