Who Are the COVID-19 Unemployed in Oregon?
By Damon Runberg
One of the most visible and devastating impacts of the state’s stay-at-home order to protect us from the human health crisis presented by COVID-19 has been mass layoffs. Tens of millions of initial claims for unemployment insurance were filed across the nation in the first nine weeks of the crisis. Here in Oregon about 412,000 initial claims for traditional unemployment insurance were received in the first nine weeks, just shy of 20 percent of the statewide labor force.
During “normal” times we would typically not talk too much about unemployment insurance claims. Even during our last recession that began in 2008, the increase in unemployment insurance claims was relatively gradual. The rapid onset of the COVID-19 restrictions meant that our traditional economic indicators, such as total nonfarm employment or the unemployment rate, could not immediately show the severity of this economic shock. That left us with the unemployment insurance claims data as one of the few indicators in the first weeks of the shock that could help us understand the magnitude of the crisis.
We now have nine weeks of processed initial claims data representing more than 290,000 initial claims, which is a large enough group for us to draw some conclusions about industries, areas, and populations most impacted at the onset of the crisis.
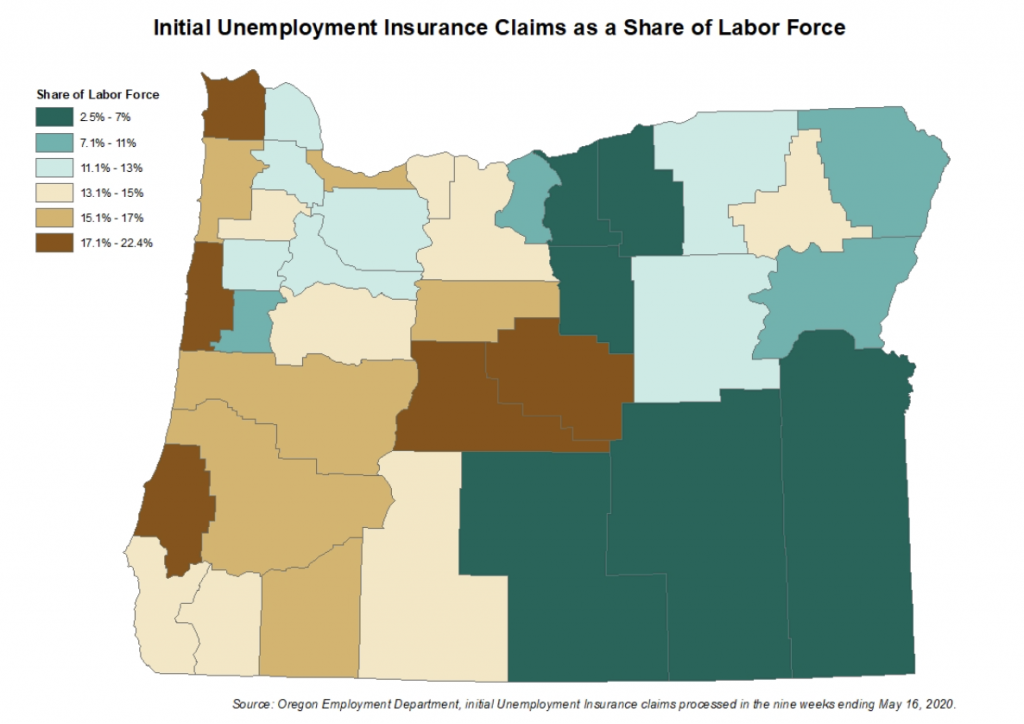
Let’s start with the regional distribution of these initial unemployment insurance claims. Not surprisingly the most populated counties have the largest number of initial unemployment insurance claims, with Multnomah (69,100 claims) and Washington County (36,823 claims) in the Portland Metro area topping the list of counties with the highest number of claims processed. However, we can see a clearer picture of the hardest hit counties by looking at the number of initial claims as a share of the total labor force. Here we see that counties with large accommodation and food service sectors and tourism destinations were the hardest hit. The number of initial claims processed in Lincoln County represented over 22 percent of the labor force and around 21 percent of the labor force in Clatsop County. Deschutes County accounted for the highest share of unemployment insurance claims processed of Oregon’s metropolitan counties, accounting for nearly 18 percent of the Bend MSA labor force.
The counties least impacted nine weeks into the crisis are the least populated in the state. They are likely ranked so low due to proportionally smaller concentration of local employment in restaurants or other businesses directly impacted by the COVID-19 restrictions, including health services and retail trade.
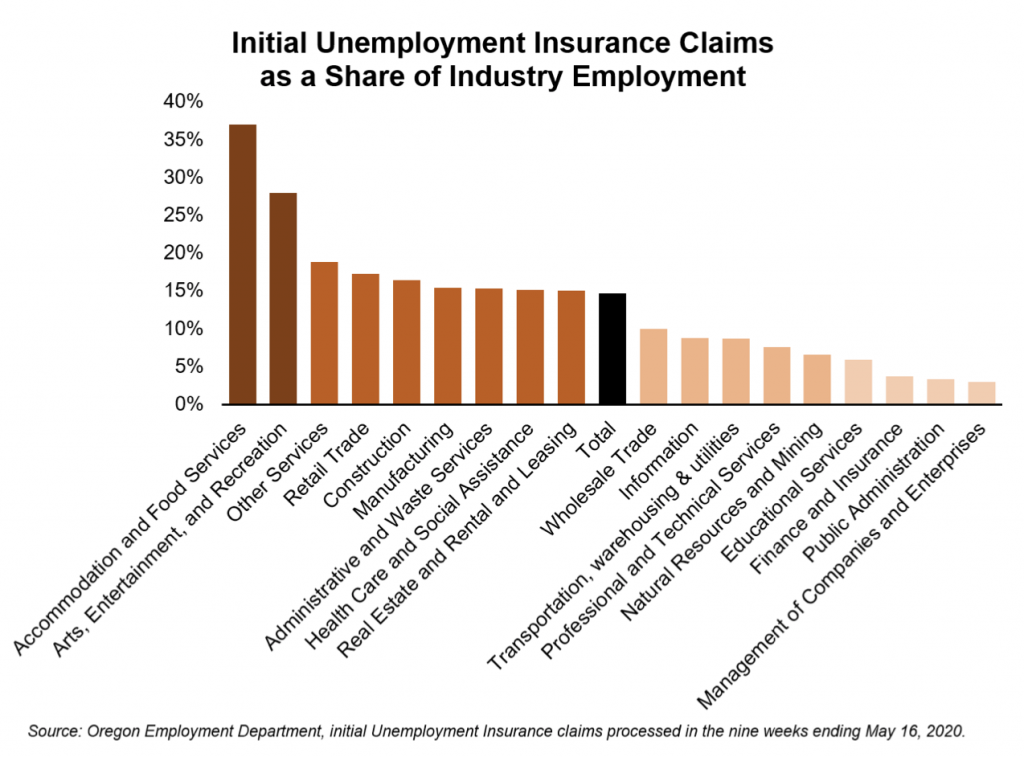
As would be expected, accommodation and food services has been the hardest hit industry during the current crisis, with initial claims processed over the past nine weeks representing 37 percent of statewide employment in the industry. Arts, entertainment, and recreation was the next hardest hit as museums, ski resorts, zoos, and other recreation companies have closed or seen their operations significantly curtailed. Another hard hit industry is “other services,” which includes personal care services like fitness instructors, childcare workers, barbers/ stylists, massage therapists, and pet groomers.
Perhaps more surprising has been the large number of initial unemployment insurance claims being processed in construction, health care, and manufacturing. These were industries that on first glance would seem more insulated from the initial COVID-19 restrictions. Health care posting large numbers of layoffs during a health crisis may seem puzzling; however, there are many health-related businesses that are not serving on the front lines of the COVID-19 response such as dentist offices, ambulatory health services, medical labs, and surgery centers. Beginning on May 1 elective procedures are being allowed across the state. We are already beginning to see the share of unemployment insurance claims from health care drop as layoffs slow dramatically and these businesses reopen.
Layoffs in construction and manufacturing are likely a result of an inability for many of these businesses to implement effective social distancing requirements. However, as this crisis continues, layoffs are increasingly due to a demand shock from less consumer spending. The one commonality among these hardest hit industries is an inability for many of the jobs to transition to work from home and the design of workplaces that makes social distancing difficult.
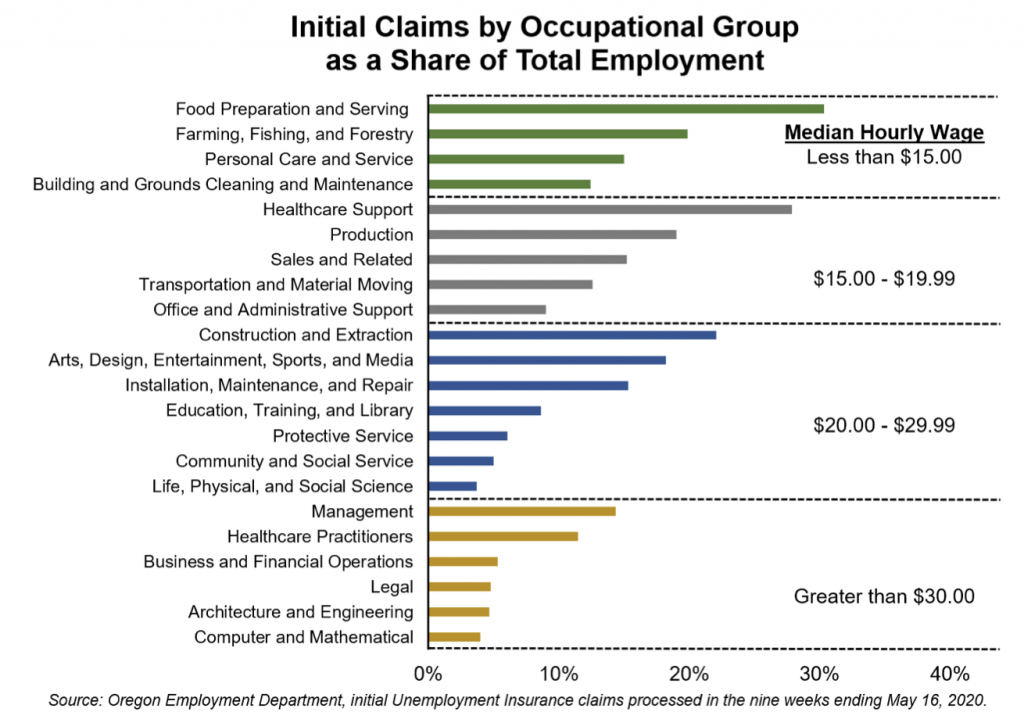
Although these COVID-related layoffs are spread across all industries, it is becoming clear that the most vulnerable Oregonians are being impacted more significantly. Lower paying occupational groups posted notably higher shares of layoffs than higher paying occupational groups. The occupational groups with a median hourly rate of less than $20 an hour represented around 68 percent of total initial claims for unemployment insurance processed over the first nine weeks. This represents a higher share than the 58 percent of statewide employment these lower paying occupations account for. Meanwhile, the highest paying occupational groups, those with a median hourly rate greater than $30, represent only 14 percent of initial claims processed, but 22 percent of total employment.
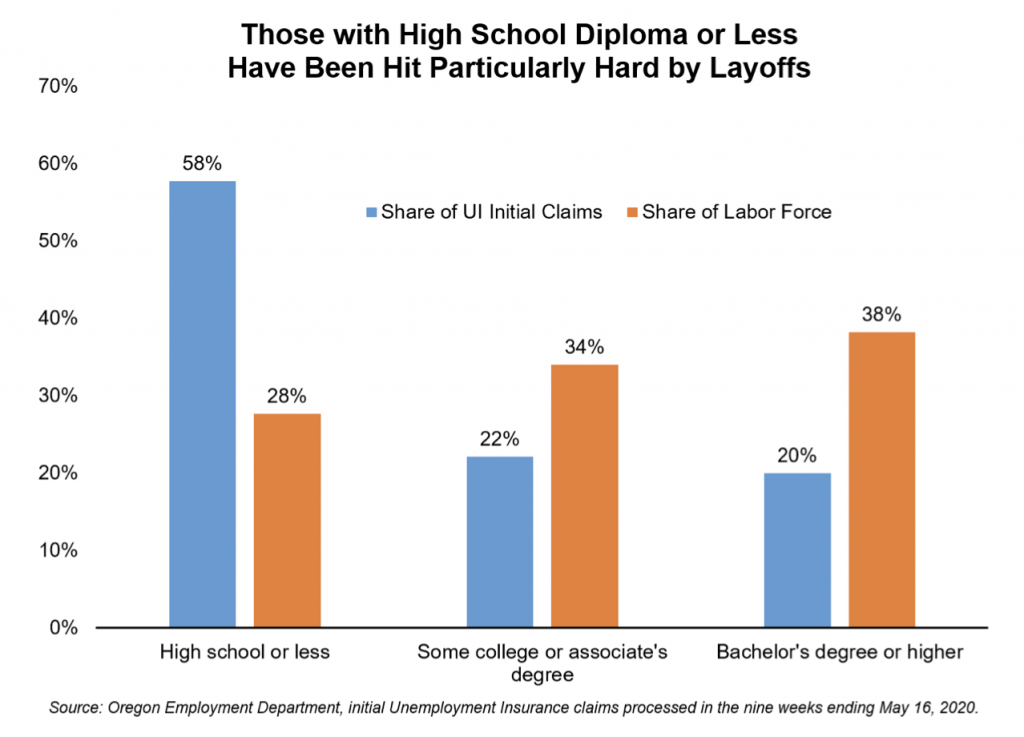
When comparing the level of education for recent unemployment insurance claimants compared with the educational attainment of the entire labor force, we see that those with lower levels of education have been hit particularly hard. This is likely a reflection of the industries that have been hardest hit, such as leisure and hospitality, construction, retail, and manufacturing that have a higher concentration of workers with a high school diploma or less. Around 58 percent of recent unemployment insurance claims were by individuals with a high school diploma or less, a significantly higher share than the 28 percent of the labor force they account for.
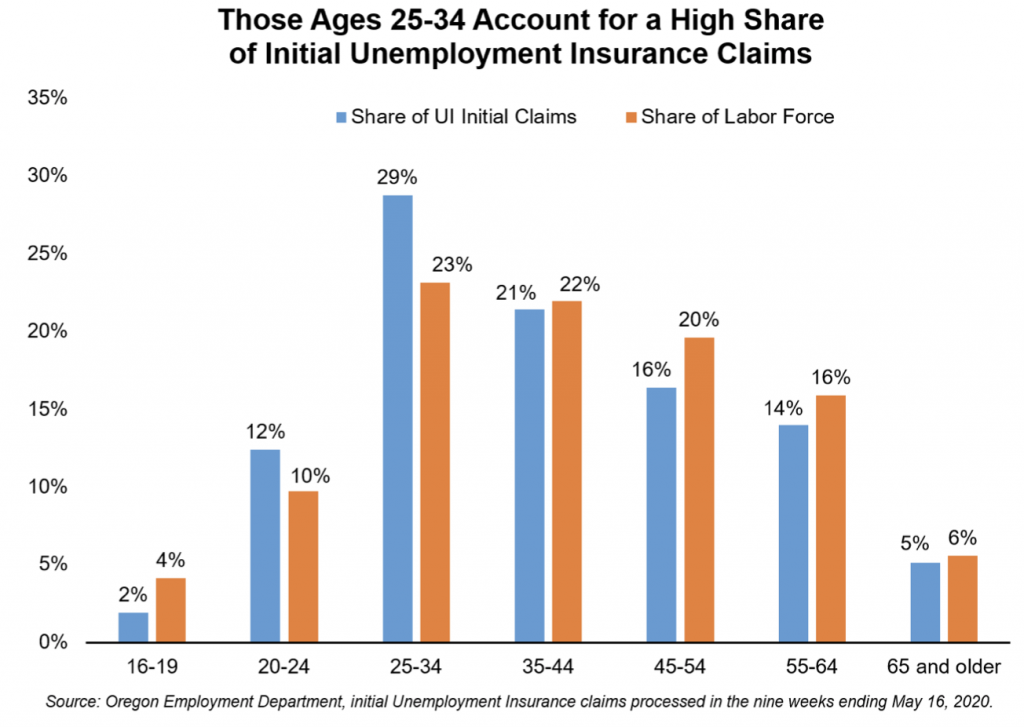
The age distribution of the unemployment insurance claimants is fairly typical of the labor force more broadly, with a few exceptions. Those ages 25 to 34 have been particularly hard hit. They accounted for roughly 29 percent of all unemployment insurance claimants in the past nine weeks, but only 23 percent of the total labor force. This age group accounts for a larger share of the jobs in industries that were particularly hard hit. It could also be that this group represents workers earlier in their career and they were more susceptible to layoffs than higher level managers or supervisors. The youngest workers (ages 16 to 19) seem to be the least impacted, accounting for only 2 percent of total claimants. However, this is likely a reflection of lack of unemployment insurance coverage for these young workers who have fewer covered hours in the system.
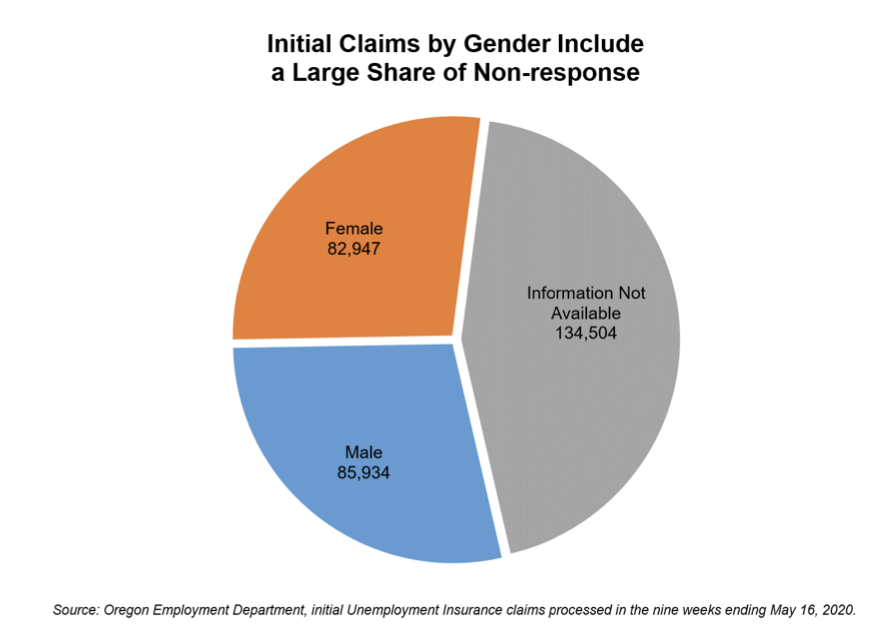
While filing for unemployment benefits claimants are asked their gender, race, and ethnicity. These questions are not mandatory, resulting in a significant amount of non-response. For instance, this early look at the data only includes gender information for around 56 percent of the 303,400 initial claims processed. The initial claims processed for men (85,934) were slightly higher than those processed for women (82,947). However, before the COVID crisis women represented roughly 36 percent of all unemployment insurance claimants. Since March 15 they’ve represented just under half of the claims that included gender.
Based on data from the U.S. Census Bureau’s American Community Survey, women represent the majority of employed workers in many of the industries hardest hit by recent layoffs, including accommodation and food services (57%); health care and social assistance (76%); and other services (55%). With women also representing a larger share of layoffs than is typical, it is likely that women are being disproportionally impacted by these COVID layoffs.
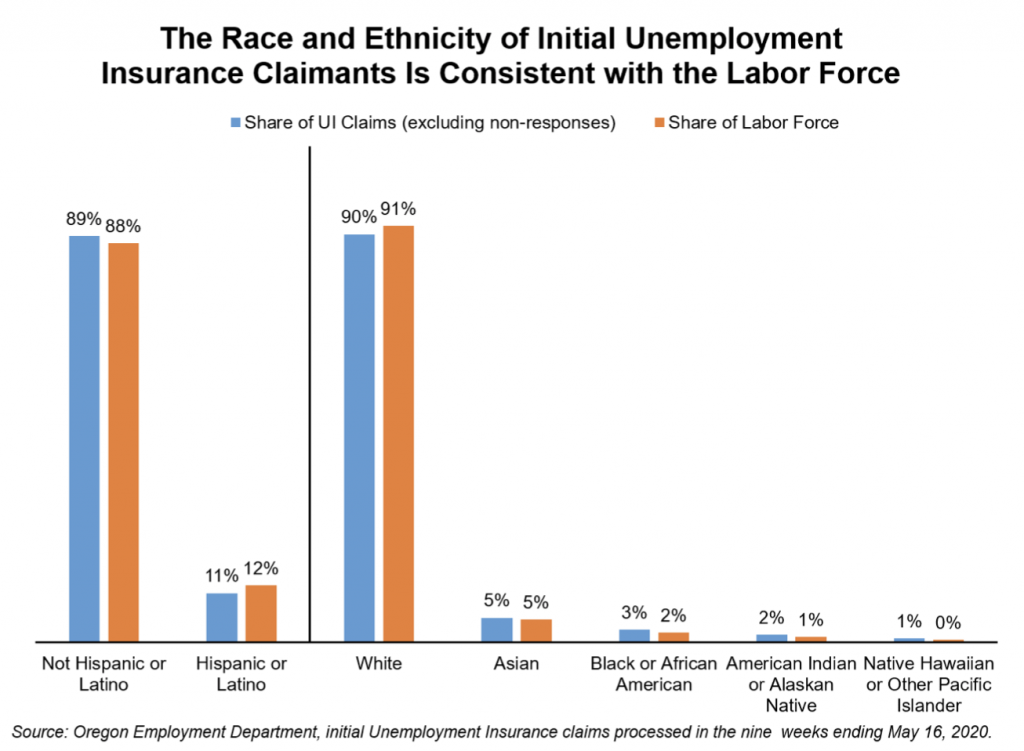
There are similar non-response issues with race. Roughly 20 percent of those filing for unemployment insurance did not identify a race or respond to the question. If we exclude those non-responses, the racial and ethnic breakout of the COVID unemployed looks very similar to Oregon’s labor force more broadly. However, similar to gender it is difficult to definitively state that all racial and ethnic groups are being impacted similarly relative to their size, as the non-response rate is high enough to leave open some uncertainty.
This is a difficult time for many of us. In addition to the emotional toll this global pandemic is taking, many of our fellow Oregonians are also struggling with the economic realities of becoming unemployed. The Oregon Employment Department is here to serve in this time of need by administering unemployment insurance. Due to the record increase in claims, it is taking longer than usual for claims to be processed. The Unemployment Insurance Division is working as fast as they can to process every claim, and they continue to add staff. They ask that you continue to file weekly and you will be notified when your claim is processed. For additional information about unemployment insurance and updates regarding new federal programs go here.
https://www.qualityinfo.org/-/who-are-the-covid-19-unemployed-in-oregon


Advertisement