Postcards from the edges: Density is not Destiny
By Joe Cortright
City Observatory
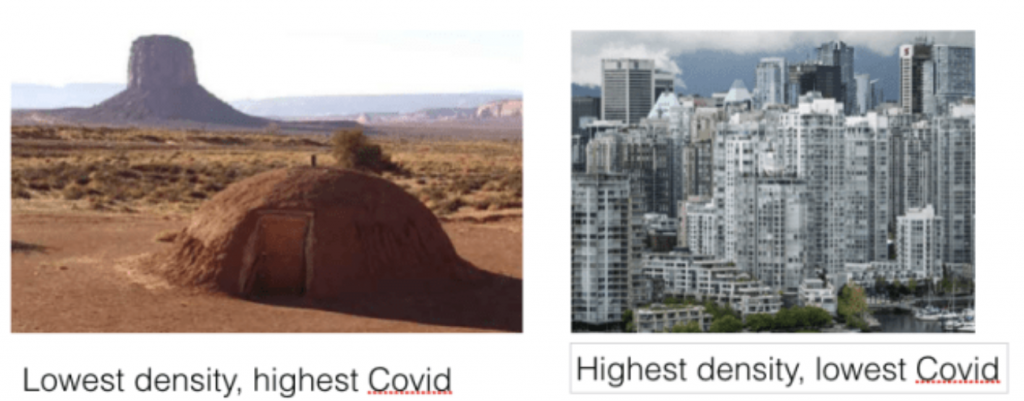
There’s a meme equating density with Covid-19 risk.
Two polar cases shows that density (or lack thereof) has little to do with the spread of the pandemic.
Many, including New York’s Governor, have been quick to blame density for the spread of Covid-19. Last month, we looked at data for one of North America’s densest cities—Vancouver, British Columbia—and found that it had a lower rate of reported cases per capita than nearly all large US metro areas. Today we check back in on the progress of the pandemic in Vancouver compared to similar American cities. And we also take a quick look on the area with the highest rate of Covid-19 cases in the US—and its one of the nation’s most rural areas, not a dense city at all.
There’s little question that the fact that the New York metropolitan area has had the highest rate of reported cases per capita has colored perceptions. People might naturally assume that because New York is our densest city, and Coronavirus hit hardest there, that there was some connection. It turns out however, that within the New York metro area, rates of reported cases are actually higher in the suburbs (including Rockland and Westchester counties) than in the five boroughs of New York City. It’s also the case that in the city itself, the hardest hit neighborhoods actually are much less dense than those least affected.
A Postcard from the Navajo Nation

Photo: Salt Lake Tribune
While New York has dominated the awful statistics and headlines of the pandemic, today, the hardest hit area in the US is far away, and far different: the Navajo Nation. In the past week, New York’s rate of infection has been surpassed by that on the Navajo Nation, one of America’s least densely settled areas. The nation covers an area larger than Ireland spread across three states—Arizona, New Mexico and Utah—and consists overwhelmingly of very low density housing. But its rate has grown to more than 2,449 cases per 100,000 population even higher than New York City’s 2,300.
The underlying problems in the Navajo Nation are not density, but rather poverty, a lack of health care, and housing over-crowding. Interestingly, these same factors were identifies as correlates of Covid prevalence rates within New York City by a Furman Center analysis of zip-code case data.
A Postcard from Vancouver
As we pointed out last month, if you think that the Coronavirus is spread by density, riding public transit, and tight connections to China, then you’d have to believe that Vancouver, British Columbia would be squarely in the cross-hairs of the pandemic. Vancouver is one of the five densest cities in North America, has a much higher than average transit ridership, and a large Chinese immigrant population. But when we looked in April, its rate of Covid-19 cases per capita was lower than in just about any large US metro area, and lower than in nearby Seattle or Portland (and Portland ranked 50th of the 53 large US metro areas for Covid cases per capita).
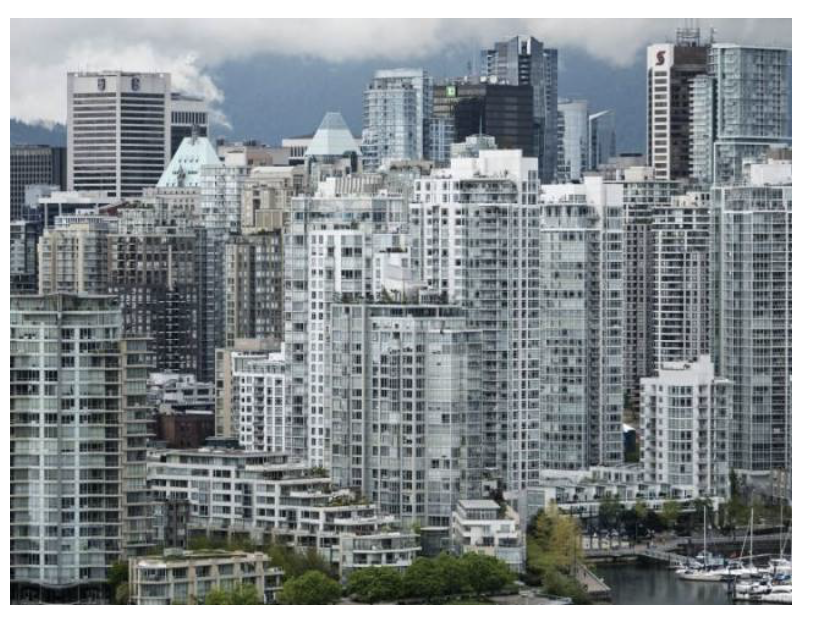
Vancouver has some of the most dense place in North America, and still, the lowest incidence of Covid-19. (Photo: Global News)
Metro Vancouver is the densest city in Canada, with a density of more than 5,000 residents per square kilometer. It’s the fifth densest large city in North America, and in the US, only San Francisco and New York have higher densities.. Two-thirds of its residents live in multi-family housing. In addition, Vancouver is a global gateway city with substantial tourist and business travel, close ties to Asia, and a large immigrant Chinese population. Metro Vancouver has more than a quarter million residents who were born in China or Hong Kong. A high fraction of its residents use the city’s excellent transit system. A recent city report shows that a majority of all trips were made by walking, cycling or transit.
Last month, we reported that through mid-April, Vancouver had reported about 45 cases of Covid-19 per 100,000 population, noticeably lower than the 54 per 100,000 in Portland and a fraction of the 200 cases per 100,000 in Seattle. But as we know, the virus doesn’t stand still, and some places that initially avoided the pandemic—like the Twin cities—have simply experienced an outbreak later than other places.
Here we’ve updated number of cases through early May, as reported by the New York Times (for US cities) and by the British Columbia Center for Disease Control (BCCDC). In each case, we’ve adjusted for population by calculating the cumulative number of reported cases per 100,000 population. Data for Portland and Seattle are for their respective US metropolitan areas; BC data is for the two provincial health authorities–Vancouver Coastal and Fraser–that serve the Vancouver Area. Data are for May 11.
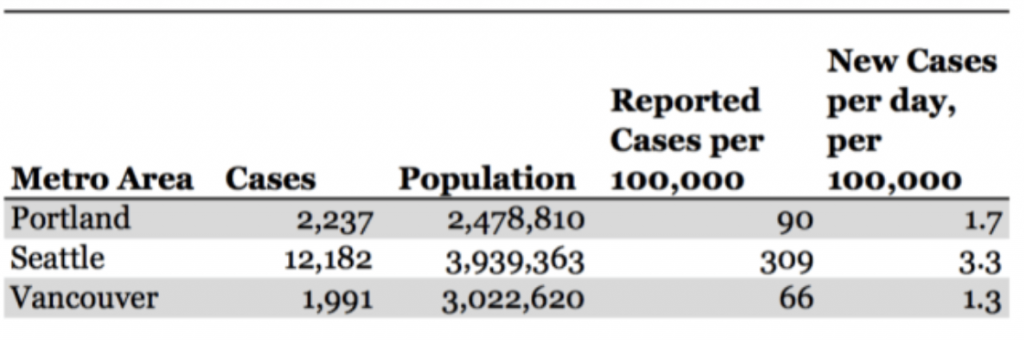
Reported Covid-19 Cases per Capita, Selected Cities
Though the number of cases has increased since April, Vancouver’s reported cases per 100,000 is still substantially lower than in both its American neighbors. In fact, metro Vancouver has a lower reported rate of Covid-19 cases than any of the 53 US metropolitan areas with a million or more population. Vancouver is in the same region, and roughly the same size as Portland and Seattle. And it is far denser, and yet it has performed the best of the three in fighting the spread of the Corona virus. It should be pretty compelling evidence that density is not a determining factor of whether one is vulnerable to the pandemic or not.
The Navajo Nation, with a population of just 174,000, has had twice as many cases (more than 4,000), than the Vancouver metropolitan area (population 3 million). These two post-cards from the edge, one from an extremely low density place with the highest rate of reported cases per capita, and the other from and extremely high density place, with a lower rate of cases per capita than any large US metropolitan area, should give pause to anyone asserting that urban density is an important driver of the pandemic.

Advertisement