Oregon’s Nonprofits in 2018
August 13, 2019
By Dallas Fridley
A not-for-profit corporation, commonly referred to as a “nonprofit,” is organized to achieve a purpose other than to generate a profit. These entities qualify for federal tax exempt status and must reinvest any surplus revenues into efforts that further the mission of the organization. They are prohibited from passing profits on to those who control the organization. These organizations range from trade unions and religious groups to food banks and private schools. Many hospitals are also organized as nonprofit corporations.
The services are essential. Wages earned by employees at nonprofits are too. For the purposes of this article, the impact presented is limited primarily to employment and wages.
Oregon’s 2018 nonprofit stats:
- 9,800 nonprofit establishments
- 196,300 nonprofit jobs
- 43 percent of all nonprofits were in the other services industry
- 61 percent of nonprofit employment was in health care
- $52,038 in annual average pay
- $23.07 median hourly wage (1st quarter 2018)
- 23 percent of nonprofit jobs paid $15.00 or less per hour
- Most nonprofit jobs – 59 percent – paid $20.00 or more per hour
Keep in mind that not all nonprofit organizations are employers – and these organizations would be overlooked if relying solely on employment data. Nonprofits in Oregon must register and be certified by the Secretary of State’s office, while the Department of Justice regulates charitable activities.
The Secretary of State’s office provides a searchable database of active nonprofit corporations, available at this URL:
https://data.oregon.gov/Business/Active-Nonprofit-Corporations/8kyv-b2kw
Likewise, the Department of Justice has a searchable database for Oregon charities, here:
https://www.doj.state.or.us/charitable-activities/
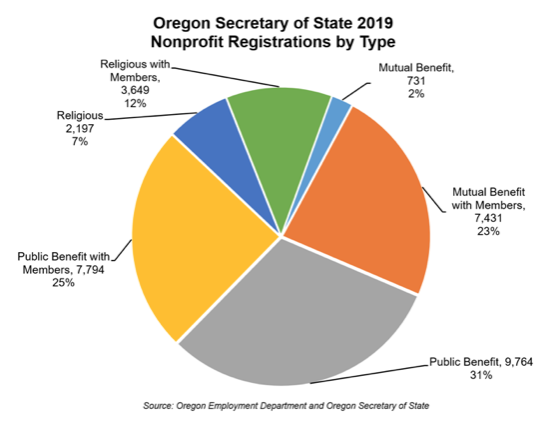
In August 2019, the Department of Justice database includes about 20,900 registered Oregon charities, while the Secretary of State’s registry listed nearly 31,600 nonprofits, as presented in the accompanying chart.
How Many Nonprofit Employers Are There in Oregon?
In 2018, there were 9,800 nonprofits business units that filed an employment report in Oregon. Most of these employers (94%) averaged one or more jobs in 2019 but around 600 units missed that threshold. Nonprofit organizations played an integral role in Oregon’s economy. They made up 6.2 percent of all private businesses in the state and had 196,300 jobs, accounting for 11.9 percent of Oregon’s private-sector employment. As a share of Oregon’s total (private and public) employment, nonprofits made up 10.3 percent in 2018, about the same amount as the manufacturing industry (10.2%).
Beyond employment, the organizations make available essential human and education services that for-profit private companies do not provide. The services offered by nonprofits often complement those provided by the public sector. Unlike the public sector, which is often required by law to provide human and education services, nonprofits are beholden to a mission, not a state or federal statute. The organizations are compelled to extend their hand to every community member who walks through their doors.
Nonprofits by Industry
Health care and social assistance dominated Oregon’s nonprofit employment in 2018, representing 119,900 jobs or 61 percent. Other services included 25,400 nonprofit jobs and educational services employed 21,100. Together the top three industries represented nearly 85 percent of Oregon’s total nonprofit employment.
Service Organizations
The other services industry had about 13 percent of the state’s 2018 nonprofit employment (25,400 jobs). The correlation between other services and nonprofits makes sense. It is the industry that includes religious, grant making, civic, professional, and similar organizations. Places of worship, the Boys & Girls Club, The United Way, and local chambers of commerce are some of the most widely recognized nonprofits in Oregon, and there are a lot of these organizations across the state. The graph based on firms shows that the industry included 43 percent of Oregon’s nonprofit organizations (4,250).
Nonprofit Hospitals: Health Care and Social Assistance
Health care and social assistance led nonprofits with 119,900 jobs or 61 percent of Oregon’s nonprofit employment. Like other services, the industry is diverse, covering activities from assisted living facilities to mental health services. However, hospitals dominate the sector’s employment. Oregon’s nonprofit hospitals (general medical and surgical; psychiatric and substance abuse; and specialty) included 68 reporting units in 2018 and employed 56,200, or close to half (47%) of the nonprofit health care and social assistance industry’s. Hospitals in Oregon (government and private) included 97 reporting units and provided 68,000 jobs in 2018, with nonprofit hospitals representing about 83 percent of the employment.
Educational and Employment Training Providers
Educational services accounted for 11 percent of Oregon’s nonprofit employment in 2018 (21,100 jobs). The organizations in this industry range from preschools and tutoring services to colleges and employment training places. Nonprofit elementary and secondary schools represented the biggest slice with close to 9,900 jobs (47%) and 345 reporting units (41%). Nonprofit colleges, universities, and professional schools accounted for just over 9,000 jobs (43%) while representing 18 percent of the nonprofit educational services provider reporting units. Other schools and instruction, including sports training, provided nearly 1,500 jobs (7%), and a more significant 21 percent of nonprofit educational services provider reporting units.
Pay at Nonprofits Follows Industry Standards
Oregon’s private for-profit industries paid an average $52,038 in 2018, compared with $51,844 for nonprofits, a difference of just $194, or 0.4 percent. The 2018 data show that annual average wages in Oregon typically have more to do with the industry than for-profit or not-for-profit status.
In 2018, four industry sectors reported higher annual average wages for nonprofits compared with for-profit businesses. Nonprofits in financial activities paid an average of $78,965 in 2018, which exceeded for-profit pay by about $10,100 or 15 percent. Leisure and hospitality also favored nonprofits by just over $4,700, despite having a relatively low annual average pay of just $27,245.
Health care and social assistance, Oregon’s largest nonprofit industry, enjoyed a pay advantage of more than $12,500 or 27 percent over for-profit employers, paying an average of $58,089 in 2018. Other services, with 13 percent of nonprofit employment, averaged $30,733 in 2018, falling about $4,300 or 12 percent below for-profit employers. Educational services, with 11 percent of Oregon’s nonprofit employment, paid an average of $40,170 in 2018, exceeding for-profit pay by more than $6,800 or 20 percent.
Rural Versus Urban
Oregon’s 23 nonmetro counties provided a home base for about 1,800 nonprofit employer units in 2018 or 7.2 percent of all rural employer reporting units. Nonprofit organizations provided about 22,500 rural Oregon jobs, or close to 9 percent of all industries employment. Rural nonprofit pay averaged $44,466 in 2018, which exceeded the average for all industries by about 13 percent or around $5,100.
In Oregon’s metropolitan areas, nonprofits provided close to 173,900 jobs in 2018, or 10.5 percent of all metro employment. With 8,050 employer units, metros provided a home base for nearly 82 percent of Oregon nonprofits while representing just 5.8 percent of all metro employer units. In 2018, nonprofit pay averaged $53,016 in metro Oregon, falling 3.2 percent (about $1,800) below the all industries average.
Only four rural counties employed more than 1 percent of Oregon’s nonprofit employment in 2018. Douglas County led rural Oregon with about 3,300 nonprofit jobs, or 1.7 percent of Oregon’s total, followed by Klamath County (1.4%), Umatilla County (1.1%), and Wasco County (1.0%). Metropolitan areas commanded 88.6 percent of Oregon’s nonprofit employment led by Multnomah County’s 33 percent (about 65,300 jobs). Together with Washington County (10.8%) and Lane County (8.5%), Oregon’s top three metro counties represented more than half (52.5%) of all nonprofit jobs in 2018.
The real impact of nonprofit employment across the state can be seen in the accompanying map. In 2018, there were 14 counties where nonprofit employment made up 10 percent or more of total county employment.
Charitable Giving
The IRS produces tax data for itemized returns showing deductions for charitable giving. According to the IRS definition, a charitable contribution is when you donate money (including securities or business ownership interests), goods or services to an organization and deduct the market value of this contribution on your income tax return. Your charitable contribution can be given to:
- Churches, synagogues, temples, mosques, and other religious organizations
- Federal, state and local governments, if your contribution is solely for public purposes (for example, a gift to reduce the public debt or maintain a public park)
- Nonprofit schools and hospitals
- The Salvation Army, American Red Cross, CARE, Goodwill Industries, etc.
- War veterans’ groups
- Expenses paid for a student living with you, sponsored by a qualified organization
- Out of pocket expenses when you serve a qualified organization as a volunteer
In 2016, 45.5 million U.S. tax returns were itemized – representing close to 30 percent of all returns. About 37.1 million returns claimed a charitable contribution; accounting for 82 percent of all itemized returns. The average 2016 itemized charitable contribution was $6,349, representing about 18 percent of all deductions claimed.
In Oregon, itemized charitable contributions averaged $4,935 or about 15 percent of all itemized deductions. A somewhat lower share of Oregon itemized returns, 79 percent, included a charitable deduction. It is important to recognize that adjusted gross income (AGI) varies widely from state to state – with U.S. AGI for all returns averaging $69,351. Oregon’s AGI averaged $66,438 in 2014, ranking 18th among U.S. states (and the District of Columbia). Oregon’s itemized charitable contribution ranked 41st out of 51, well below first place Wyoming’s $12,991. That matches up pretty well with the Pew Research Center’s 2014 Religious Landscape Study, which ranked Oregon as the 39th most religious state (49% of adults were “highly religious”). Alabama, the most religious state according to the Pew Research study (77% “highly religious”), ranked 10th for its itemized charitable contribution ($7,543), while its AGI ranked 46th. Getting back to Wyoming, 54 percent of its adults were defined as “highly religious,” ranking 22nd, while its AGI ($70,800) ranked 14th.
The Future of Nonprofit Employment
The future of nonprofit employment in Oregon is directly linked to the future of the health care and social assistance industry. The nonprofit health care and social assistance industry doesn’t rely exclusively on charitable contributions, although these businesses often hold a direct religious affiliation. Private health care and social assistance grew by about 5,200 jobs or 2.2 percent in 2018 while an additional 16,700 jobs moved into the industry with the reclassification of home care workers from state government. The industry averaged about 257,900 in 2018, a one-year increase of 9.3 percent. With 61 percent of Oregon’s nonprofit employment in 2018, health care and social assistance will largely determine how and where new jobs are gained.
For example, Providence Health & Services in Oregon is a not-for-profit network of hospitals, health plans, physicians, clinics, home health services, and affiliated health services. Providence is the largest health care provider in Oregon and one of the largest private employers in the state. It reported 2016 employment of 20,597 in Oregon, of which 3,650 were active medical staff. Providence health plans cover about 600,000 Oregonians, while reporting a community benefit of $417.5 million.

Advertisement