Oregon Agricultural Statistics
BASIC ECONOMIC IMPACT ANALYSIS
What businesses are included in the agriculture, food and fiber industry? Since the last report we have reconsidered what industrial sectors to include in the aggregated agriculture, food and fiber industry. We must include the farmgate and dockside production sectors (e.g. grain farming, beef cattle ranching and fishing), agricultural support services, food processing (e.g. frozen fruits, juices and vegetables manufacturing and seafood processing), and fiber processing (e.g. fabric mills and leather and hide tanning). The industries that take agriculture, food and fiber products from the farmgate and/or processors to market or the consumers are not regularly reported as part of economic impact analyses. Economic analyses have typically focused on producer prices and backward linkages to suppliers.
While the majority of food and fiber goods sold in retail trade (food and beverages) and used by food services and drinking places are from outside Oregon, significant portions of retail trade (food and beverages) and food services and drinking places sell and use Oregon products.
Oregon State University and the Oregon Department of Agriculture support these sectors both directly and indirectly.
The Oregon Department of Agriculture regulates food stores and licenses and inspects nearly every type of food establishment in Oregon except for restaurants (county health departments inspect restaurants). Since the majority of inputs to the retail and food services and drinking places sectors are not produced in Oregon, a subtotal for the products that are all produced in Oregon has been provided in Tables 11 and 12.
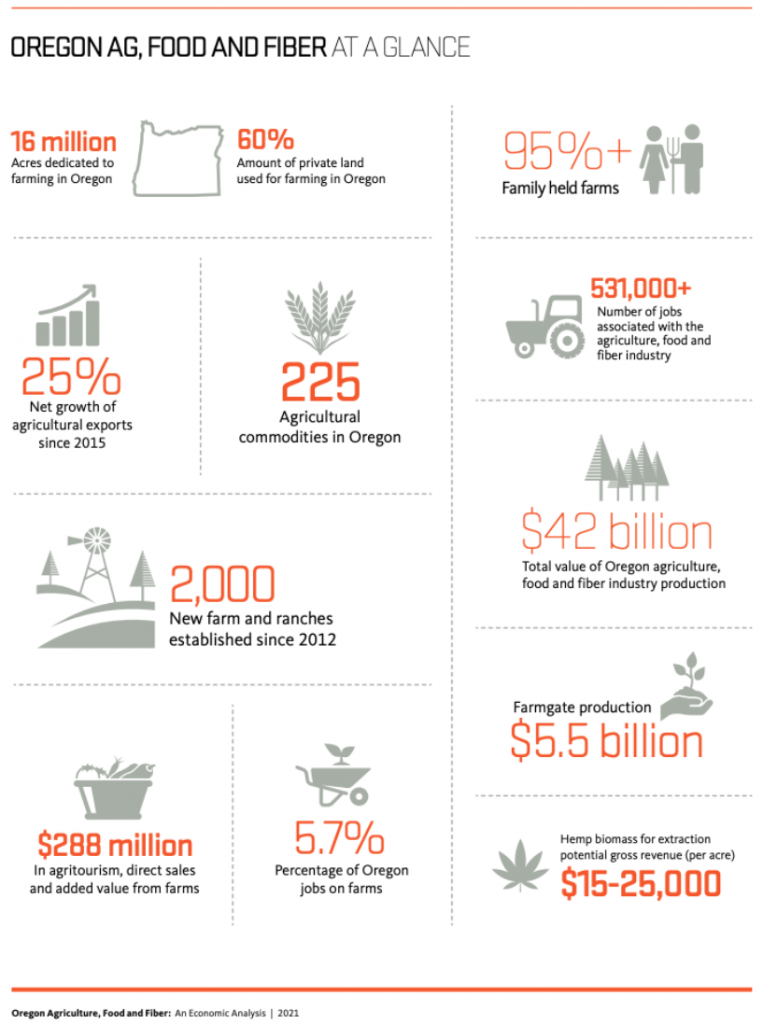
Oregon Farm and Ranch Overview Oregon is home to approximately 37,400 farms and ranches. This number is based on 2017 Agricultural Census estimate of 37,616 and the 2019 USDA estimate of 37,200 weighting the number more towards the 2019 small sample survey.
It is notable that both estimates reverse a trend that began after 2002 of declining numbers of farms. A farm is defined as any place from which $1,000 of agricultural products were produced and sold, or normally would have been sold.
These farms and ranches grow and raise over 225 different crops on 16 million acres.
Oregon’s principal producers on farms and ranches make up 1.3% of Oregon’s population and more than 2.0% of Oregon’s workforce.
When paid and unpaid workers and non-principle producers are added to principle producers they are 4.6% of Oregon’s population. Producers and hired workers comprise more than 5.7% of Oregon’s workforce.
While a farm or ranch is a business entity, much of the work may be contracted out to labor or other types of input suppliers. Over the years the decline of the number of farmers may have been exaggerated. Certainly, production efficiencies have reduced the need for farm labor.
Yet, the changes in the operator to hired labor ratio and living arrangements for hired labor has moved “farmer” or farm labor residences off the farm though the work is still done on the farm. Whereas in the past each farm was very vertically integrated (on farm residents did all or most operations from soil preparation to harvest), now many of the steps in production e.g. spraying or baling, may be contracted out to other farmers or off farm contractors.
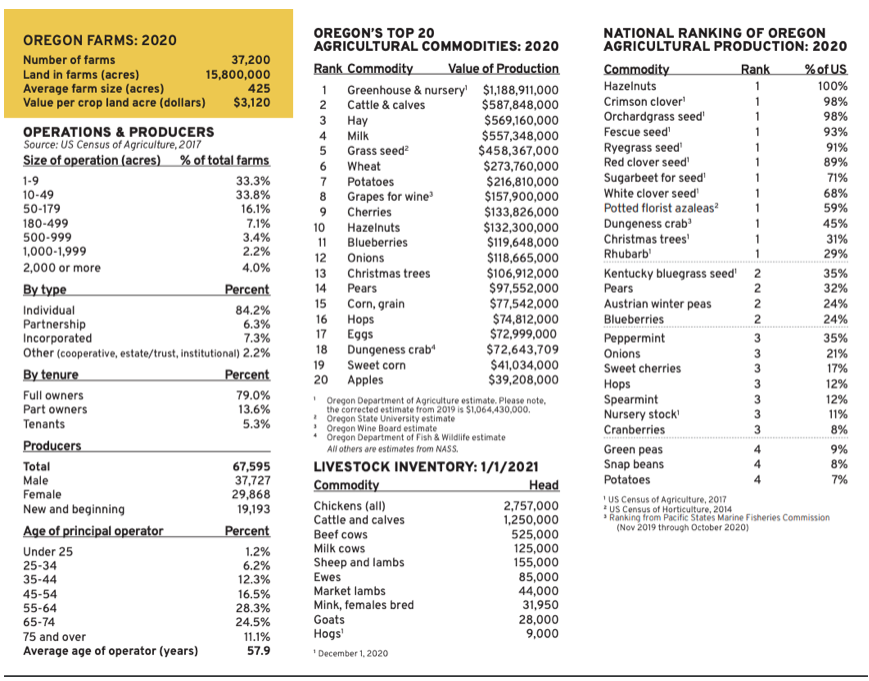
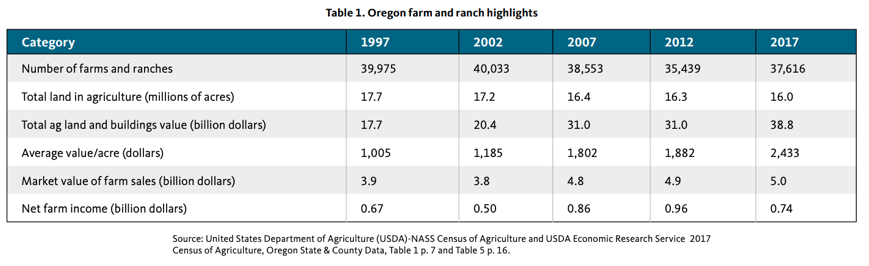
Table 1 provides a snapshot of Oregon farms and ranches. Note the value of farm sales estimates are in current year dollars rather than real dollars indexed to a single year, the Producer Price Index for agricultural commodities does not consistently rise. Many years it falls so current year dollars can provide a reasonable approximation for comparative purposes. As Table 1 shows, while the number of farms has increased the acreage continues to decline, with the USDA acreage estimate for 2019 at 15.8 million acres. The decline in acres may be considered in terms of the increasingly efficient use of inputs noted above and the increasing per acre productivity. The number of farms increased during 2012-2017 but a notable pattern emerged. There were gains in the number of very small and very large farms (as measured in acres), but losses in the number of mid-sized farms. For example, farms 1-9 acres in size rose by 3,417 to the point that they now represent one-third of all Oregon farms.
Meanwhile, mid-sized farms between 50 and 179 acres, 180 to 499 acres, and 500 to 999 acres fell by 881, 289, and 101, respectively. The very largest farms (2,000 or more acres) increased by 1.4 percent; such that Oregon gained 21 more very large farms between 2012 and 2017.3 The rise in very small farms likely reflects growth in organic farming, value-added on-farm operations, direct sales, and agritourism. These are relatively labor-intensive activities. The opposite likely happened with respect to the largest size class of farms. The rise in very large farms likely reflects consolidation as a means to attain economies of scale in production, and ultimately the ability to compete in a marketplace with intense price competition. Expensive technologies such as large GPS-guided machinery and large-scale irrigation systems require massive fixed-capital investments.
With sufficient volume, however, the per unit cost of production can be quite low. Therefore, consolidation and high capital investments goes hand-in-hand with the high levels of volume necessary to accommodate low profit margins. The rise in very small farms, however, suggests that interest in farming is growing across a broad swath of the population. Farmers with smaller acreages may be growing very high value specialty crops, or crops with attributes that consumers value such as local production. Alternatively, very small farms may be sustained by off-farm income earned by one or more family members.
See full 2021 economic impact report at https://agsci.oregonstate.edu/sites/agscid7/files/main/about/oragecon_report_2021.pdf

Advertisement