Is Stagflation Back?
By Rachel Eliot
Accountant at People’s Bank of Commerce
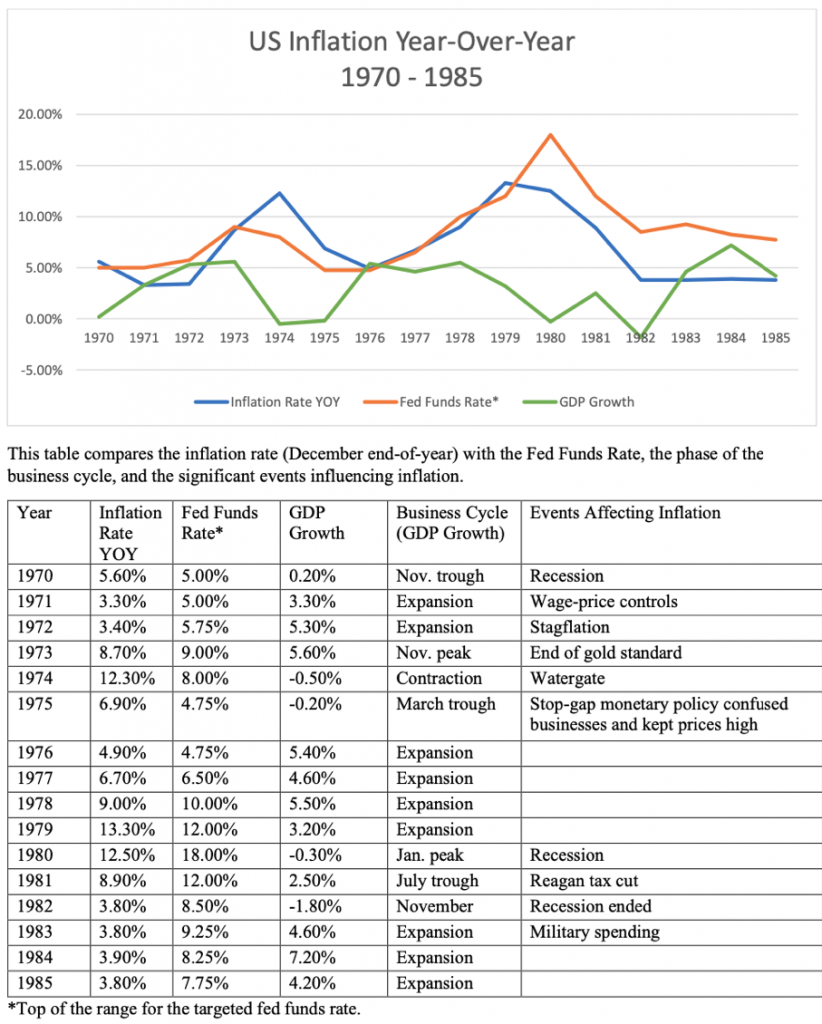
In the early years of the 1970’s the easy-money policies of the American central bank designed to generate full employment resulted in high inflation. The great inflation began in late 1972 and continued through the early 1980’s. The 1970’s saw some of the highest rates of inflation in recent history, rising to nearly 20% by the end of the decade. The great inflation was blamed on many factors including oil prices, union leaders, and weak economic growth. Many economists point towards monetary policies that financed budget deficits and the OPEC Oil Embargo of 1973.
The Organization of the Petroleum Exporting Countries (OPEC) instituted an oil embargo in 1973 creating hyperinflation. In order to neutralize hyperinflation from the oil embargo, the Federal Reserve raised short-term interest rates. While this increased the value of savings deposits, the cost of borrowing funds also increased.
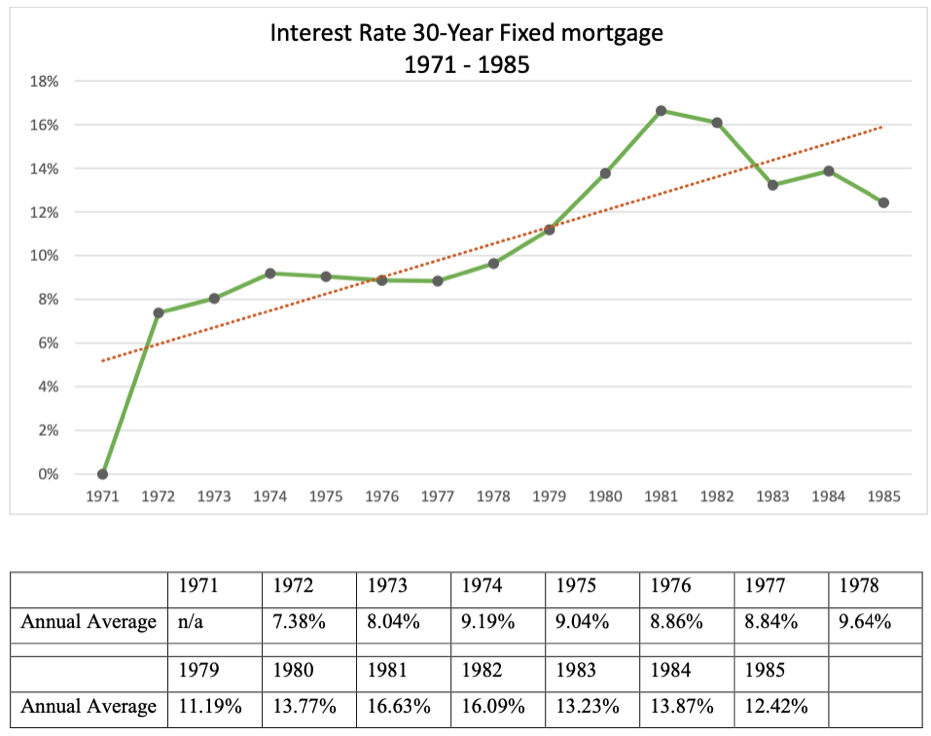
Freddie Mac began recording 30-year fixed-rate mortgage rates and points in April 1971. Rates in 1971 were in the mid-7% range, and steadily increased to 9.19% by 1974. By 1979 the annual average 30-year fixed mortgage interest rate was 11.19%, with rates hitting a peak annual average of 16.63% in 1981.
The Oil Embargo of 1973 was imposed against the United States in retaliation for the U.S. providing military aid to the Israeli military and to gain leverage in peace negotiations of the 1973 Arab Israeli War. The embargo banned petroleum exports to specific nations, reduced oil production and contributed to oil barrel costs quadrupling in a short matter of time. During the oil embargo, inflation adjusted oil prices went from $25.97 per barrel in 1973 to $46.35 per barrel in 1974. The COVID-19 pandemic drastically reduced the demand for oil around the world. The first quarter of 2020 consumption in the United States averaged 94.4 million barrels per day, a 5.6 million decrease from the prior year. The price of oil is expected to average $56 per barrel throughout 2021 and increase to an average of $60 per barrel in 2022.
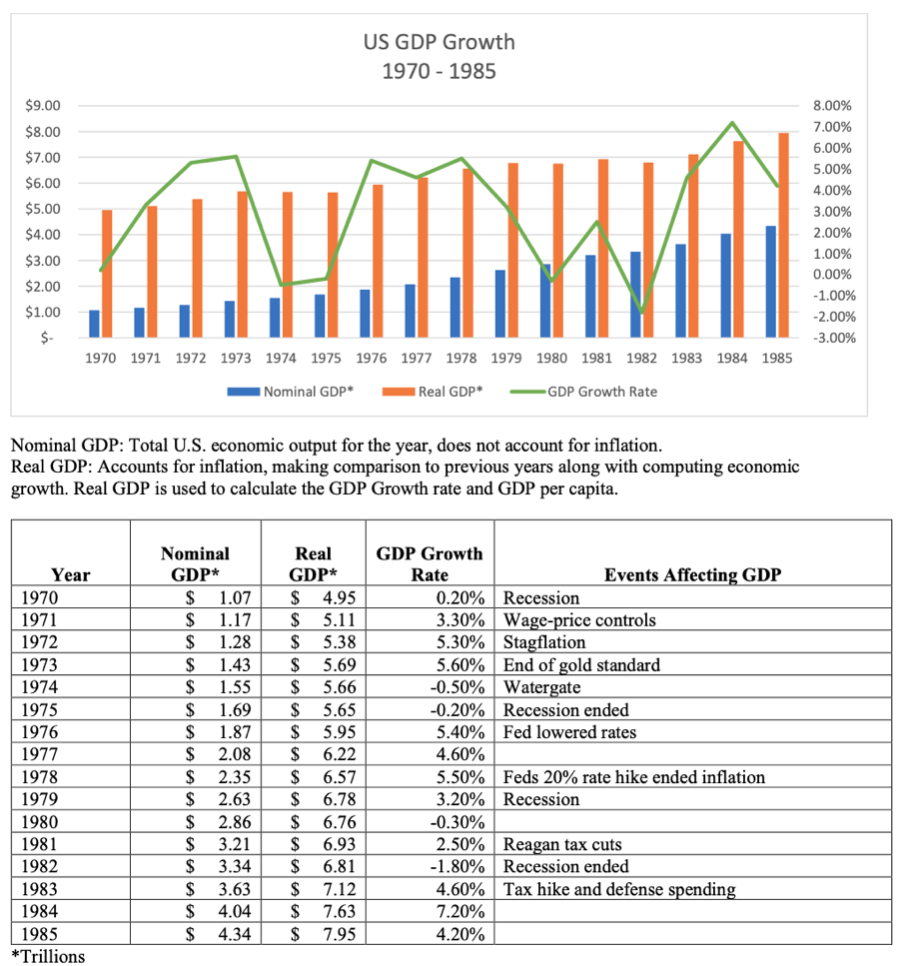
The 1973 Oil Embargo coincided with the Nixon Shock beginning in February 1973, after an unsuccessful devaluation of the U.S. dollar in December of 1971. Nixon took three actions to create the shock including a 90-day freeze on all wages and prices, a 10% tariff on imports, and removed the United States from the gold standard. The Nixon Shock and Oil Embargo together inevitably became the catalysts for Stagflation of the 1970s.
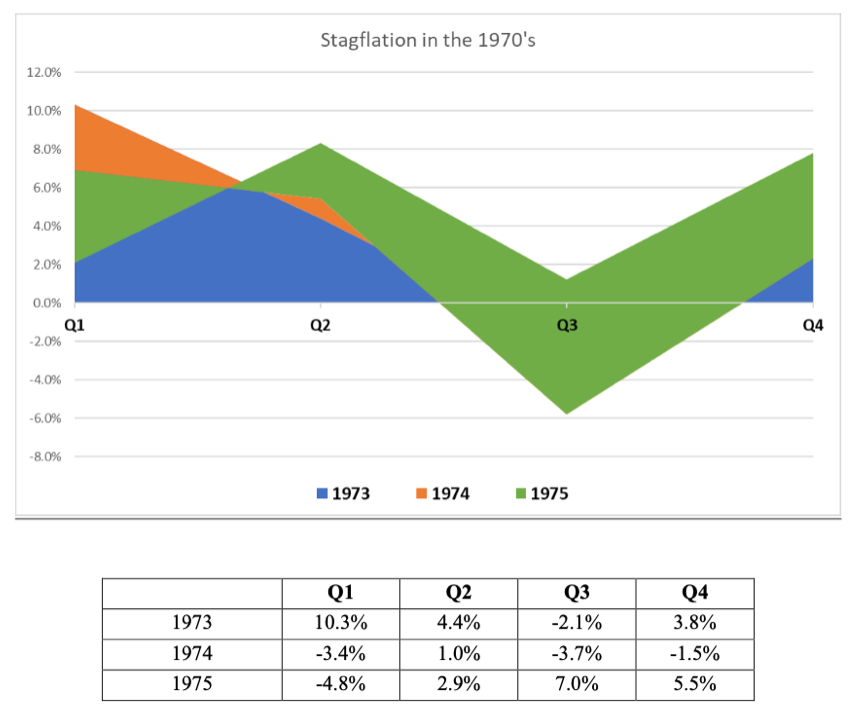
Stagflation appeared during the 1973-1975 recession, where gross domestic product (GDP) reported five quarters of negative growth.
Inflation nearly tripled in 1973, rising from 3.6% in January to 8.7% in December, followed by a greater range of 10% to 12% beginning in February 1974 through April 1975. In May 1975 unemployment reached a peak of 9%, two months after the recession ended. Between 1971 and 1978 the Federal Reserve attempted to fight stagflation, but only worsened it. The Federal Reserve created a Stop-Go monetary policy by raising the fed funds rate to fight inflation and then lowering to fight the recession.
Businesses could not adjust prices quickly enough when the Fed lowered rates, which sent inflation up to 13.3% by 1979.
The GDP had a challenging year in 2020 falling and rising more than 25% as the country was shut down then slowly reopened. The first quarter of 2021 showed GDP growth of 6.4%, with most of the increase caused by government spending. Government spending comprised 31% of GDP during 2020, far higher than the average 20.4% over the last 50 years. In Spring of 2020 the government injected $3 trillion into the economy, $900 billion in December 2020 and another $1.9 trillion in March 2021.
One of the first uses of price indexes as a measure of inflation was during the American Revolutionary war (1775 – 1783) when the pay of soldiers’ wages was based on a “market basket” of goods which included: 5 bushels of corn, 684/7 pounds of beef, 10 pounds of wool, and 16 pounds of leather. The percentage increase in the price of the market basket would be matched by the same percentage increase in soldiers’ wages to compensate for inflation. Prior to 1978, there was one index used for CPI which represented 32% of the U.S. population.
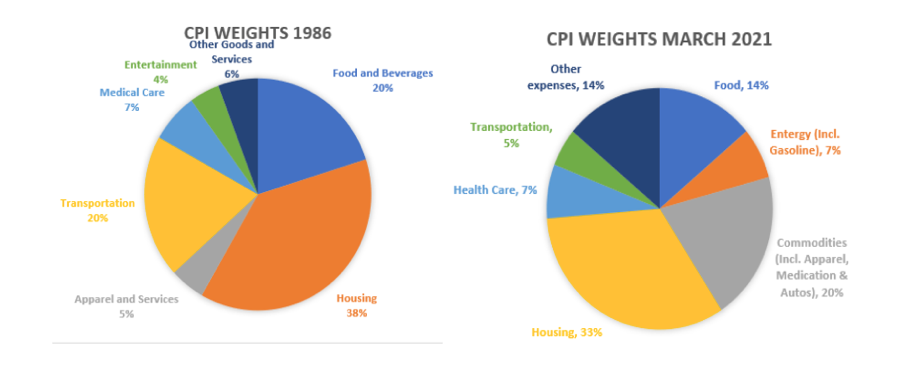
In 1978 the CPI-U was introduced representing approximately 80% of the U.S. population including self- employed, professional, managerial, technical workers, unemployed, retirees, and other not in the labor force. The CPI is often referred to as a fixed-weight price index, as the weights remain unchanged for relatively long periods. The 1978 CPI Revision was the fourth comprehensive revision of the CPI since inception in 1919. The revised weights were based on the 1972-1973 survey of consumer expenditures and the 1970 census.
The CPI weights used in 1978 were divided into seven major expenditure groups – food and beverage, housing, apparel and upkeep, transportation, medical care, entertainment, and other goods and services.
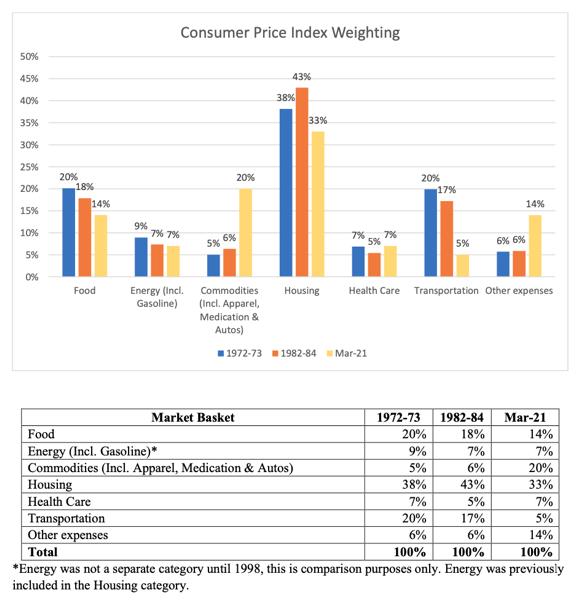
Energy was considered a special index and calculated separately from the seven major expenditures until 1998. In 1998 the sixth comprehensive revision occurred which extensively revised item classification.
Today, commodity prices are soaring at a pace not seen since the Carter administration, supply shortages are affecting almost every industry, and companies in many sectors are reporting difficulties finding workers. The annual rate of inflation has more than doubled from 0.3% in January to 0.6% in March of this year. The CPI for April 2021 rose again by 0.8% on a seasonally adjusted basis. The April CPI increase was in direct relation to a 10% price hike on used cars and trucks, which is also the highest increase for that market on record. Over the last twelve months the CPI has increased 4.2% before seasonal adjustments, the largest 12-month increase since September 2008 which saw a 4.9% increase.
On Friday, May 7, 2021, Colonial Pipeline, the operator of the largest gasoline pipeline in the U.S., was forced to shut down due to a ransomware attack. The network was compromised when 100 gigabytes of data was taken hostage. The hackers locked data on computers and servers then threatened to leak confidential data to the internet if the ransom was not paid. The Colonial Pipeline is the main source of gasoline, diesel and jet fuel for the East Coast distributing 2.5 million barrels a day from Houston to North Carolina, approximately 45% of all fuel consumed on the East Coast.
With the closure lasting 6 days, shortages and long lines occurred from Virginia to Florida and Alabama, with more than 1,000 gas stations running out of gasoline. After nearly a week of being shut down, the Colonial Pipeline paid the ransom of 75 Bitcoin, nearly $5 million, to the hacking group DarkSide. Colonial Pipeline was able to recover all stolen data and resumed operations. While the reasoning for this gas shortage is completely different than that of 1973 the impact is strikingly similar.
Every aspect of the economy has seen an increase including construction, insurance, housing, airfare, and most noticeably gasoline which rose 9.1% in March. The U.S. has reached two of the three components needed to create Stagflation with high unemployment and inflation on the rise. Low GDP growth is the third component that would signal the economy to be in Stagflation. Some conservative economists are predicting the potential for a rapid rise of inflation throughout the year and low GDP growth which could potentially cause the return of stagflation by the end of 2021.
Sources:
30-Year Fixed-Rate Mortgages Since 1971. http://www.freddiemac.com/pmms/pmms30.html
Graham, K. (2021, April 16). Historical Mortgage Rates From the 1970s to 2021: Averages and
Trends for 30-Year Fixed Mortgages. https://www.rocketmortgage.com/learn/historical-
mortgage-rates-30-year-fixed
Kramer, L. (2020, October 1). How the Great Inflation of the 1970s Happened.
https://www.investopedia.com/articles/economics/09/1970s-great- inflation.asp#:~:text=The%201970s%20saw%20some%20of,in%20turn%20to%20nearly%2020 %25.
Amadeo, K. (2021, March 01). US Inflation Rate by Year from 1929 to 2023. How Bad is Inflation? Past, Present, Future. https://www.thebalance.com/u-s-inflation-rate-history-by-year- and-forecast-3306093#us-inflation-rate-history-and-forecast
Oil Embargo, 1973-1974. https://history.state.gov/milestones/1969-1976/oil- embargo#:~:text=During%20the%201973%20Arab%2DIsraeli,the%20post%2Dwar%20peace%2 0negotiations.
Kenton, W. (2021, April 21). Nixon Shock. https://www.investopedia.com/terms/n/nixon- shock.asp
Amadeo, K. (2020, October 27). Stagflation and Its Causes. Why Stagflation (Probably) Won’t Reoccur. https://www.thebalance.com/what-is-stagflation-3305964
Amadeo, K. (2020, July 30). US GDP by Year Compared to Recessions and Events. The Strange Ups and Downs of the U.S. Economy Since 1929. https://www.thebalance.com/us-gdp-by-year- 3305543
Amadeo, K. (2021, April 15). Consumer Price Index and How it Measures Inflation. Why you should pay attention to the Core CPI. https://www.thebalance.com/consumer-price-index-cpi- index-definition-and-calculation-3305735
Chronology of Consumer Price Index. (2020, April 9). U.S. Bureau of Labor Statistics. https://www.bls.gov/cpi/additional-resources/historical-changes.htm
Stewart, & Reed. (1999). Inflation would have been lower from 1978 to the present if the current methods of calculating the CPI had been in place. Monthly Labor Review, June 1999, 1–11. https://www.bls.gov/opub/mlr/1999/06/cpimlr.pdf
Schmidt. (1987). Comparison of the revised and the old CPI. Monthly Labor Review, November 1987, 1–4. https://www.bls.gov/opub/mlr/1987/11/art1full.pdf
After Colonial pipeline attack, maneuvers to avert shortages. (2021, May 11). AP News. https://apnews.com/article/europe-government-and-politics-technology-business- 938b33938fe3a750367fb1dc2f7ce6e0
Biden’s Economy: Inflation Hits Highest Levels Since Great Recession, Soars Past Economists’ Expectations. (2021, May 12). The Daily Wire. https://www.dailywire.com/news/bidens- economy-inflation-hits-highest-levels-since-great-recession-soars-past-economists-expectations Shades Of Jimmy Carter: Gas Lines, Inflation, Rising Unemployment Return Under Biden. (2021, May 11). The Daily Wire. https://www.dailywire.com/news/gas-lines-inflation-rising- unemployment-return-under-biden
Webb, Roy H. and Willemse, Rob, Macroeconomic Price Indexes (1989). FRB Richmond
Economic Review, Vol. 75, No. 4, July/August 1989, pp. 22-32, Available at
SSRN: https://ssrn.com/abstract=2125362
Reagan, P. Inflation Outpacing Economic Growth, Threatens to Strangle Fledgling Recovery. (2021, April 23). Newsmax Finance. Inflation Outpacing Economic Growth, Threatens to Strangle Fledgling Recovery | Newsmax.com.
Biden Says Colonial Pipeline Is Nearing Full Capacity After Hack. (2021, May 14). The New York Times. Biden Says Colonial Pipeline Is Nearing Full Capacity After Hack – The New York Times (nytimes.com).
Inflation Hits a 13-Year High – Is Stagflation Around the Corner? (2021, May 13). The Western Journal. Inflation Hits a 13-Year High – Is Stagflation Around the Corner? (westernjournal.com)


Advertisement