How stories from Aviation can make us better Managers
THE LEARNING CURVE, GARY ANTHES
In this, the fourth installment of our six part series, we look at the role of Delivery in business value creation and examine, through the lens of lessons learned, an example of delivery from the field of aviation.
The picture of Boeing’s iconic 737 airliner represents a culmination of aviation lessons for business managers. In microcosm, the 737 represents the result of five activities all organizations must do to be viable. Boeing observed their environment and communicated, organized and delivered a product that it has improved over time. The ability to Observe, Communicate, Organize, Deliver and Improve are critical to business success. Moreover, the business that does these five activities well is on its way beyond viability and on its way towards achieving enterprise excellence. Last month we covered Organization with a look at Professor Richard Hackman’s observations about what makes teams work and how aircraft crews and their teamwork are influenced by the intentions of the organization and the context of their operations. This month we look at Delivery and take a lesson from aviation that can help us improve business performance.
Without the ability and capacity to deliver, why does a business exist? As managers, we waste time observing opportunity, communicating knowledge and organizing if we cannot deliver on organizational commitments and create value. The key, of course, to successful delivery rests on the skillful management of constraints and resources that affect our ability to execute efficiently (at minimum cost) and effectively (with intended results).
In 1936, Theodore Paul “TP” Wright published “Factors Affecting the Cost of Airplanes” in the Journal of the Aeronautical Sciences. TP Wright observed what became known as the Learning Curve. In the article, he outlines a pattern of behavior where costs per unit drop as quantities increase, ascribing the phenomenon to learning. Stated another way, Wright observed that the more you make of something, the better you get at it.
Central to his observation was the fact that with each doubling of the output quantity, the per unit labor hours are reduced at a constant rate. He plotted this pattern of improvement showing a gradual lowering of unit cost as the number of units increased – the natural consequence of repetition and learning (see diagram Traditional Learning Curve).
Understanding the improved utilization of labor represented in the learning curve puts the manager in a better position to improve delivery. (Cautionary Note: The Learning Curve should not be confused with Economies of Scale. Simply put, a Learning Curve typically has to do with shifts in a cost curve for a product related to learning while keeping other factors constant; Economies of Scale has to do with movement along a cost curve in a single time period associated with changes in various factors that affect costs.)
We all know intuitively that tasks become easier the more we do them – we learn from experience. Costs associated with prototypes and first article units often exceed their value in the market. This is true because at the start of any new endeavor we have not yet learned how to deliver efficiently.
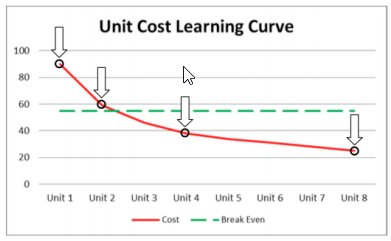
Look again at the Traditional Learning Curve diagram and envision a per unit Break-Even cost of $55 (Dashed Green line). The Cost Curve (Solid Red line) shows the first two Units ($90 and $58 respectively) exceeding the break-even point. After the second unit, per unit cost drops (because of learning) and by the delivery of the fourth unit, the product is profitable. The depiction in the diagram represents a 65% Learning Curve. This means that Unit 4 (at $38) is 65% of Unit 2 (at $59) which was 65% of Unit 1 (at $90). Every time output doubles, per unit cost drops by 35%. Practice Makes Perfect.
Traditional Learning Curve Example
In the eighty years since TP Wright published his article the forces behind the Learning Curve have been shown to be remarkably consistent. So consistent that accurate cost estimates for new products can be made based upon similarities to past products prior to production as well as after completion of the first few units. The Learning Curve model is so consistent that a manager collecting accurate information can apply it in the context of the organization’s ability to deliver desired outcomes into the future. Look again at the Traditional Learning Curve diagram. Based upon results up to Unit 4 we can see how Unit 8 will cost 65% of the Unit 4 ($38 x 65% = $25).
Learning’s impact on delivery is worthy of attention for a number of reasons. First, by using examples of past outcomes to estimate of the slope (percent change) of your learning curve will lead to more accurate delivery estimates. Second, using the learning curve with break-even analysis, we can create expectations about per unit cost at various quantities and compare actual performance to estimates. Finally, and this is perhaps the most valuable lesson, Learning Curve analysis can be applied to your business model regardless of the product and/or service you provide by focusing efforts on those aspects of delivery that under your control and benefit from learning.
Delivery of products and services takes many paths depending upon such diverse factors such as your team’s abilities, company capabilities, technology deployed, customer expectations, access to inputs, organizational culture, etc. Typically, learning curve analysis is applied to physical products in large-scale serial production. However, do not assume that the learning curve does not apply to custom, make-to-order or low volume discrete product environment. In those circumstances where custom or finite small production runs do not allow for product-based learning, you can improve delivery by focusing on workflow.
When delivering discrete or custom products/ services the common denominator is the method used to deliver results. When we focus on products, as in the case of the typical learning curve analysis, we look for efficiency but when looking at methods we strive for effectiveness. A good example of this approach is to understand how projects can benefit from the application the Learning Curve (see diagram Learning Curve Applied to Projects Example). In the job shop environment if we focus on the hours required to manage a project (the method), as opposed to hours required to make a part (the product), we will see that over time the learning curve will reflect fewer hours required to complete the same standardized project tasks.
Learning Curve Applied to Projects Example
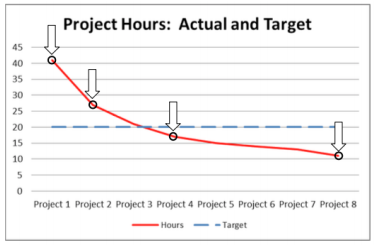
While the classic definition of a process (Repetitive set of activities that turn inputs into outputs, has a distinct beginning, a clear deliverable and that is measurable.) applies, if we focus on workflow as the deliverable, the potential for improvement becomes clear. For example, in a job shop that makes unique parts in small batches using customer-supplied drawings and specifications there is little to gain in the study of the part itself in the same way one would in a mass production situation. On the other hand, if each job is seen as a project (Nonroutine, one-time effort limited by time, budget, resources, and performance specifications designed to meet customer needs), it becomes more clear that the focus ought to be on the methods used to deliver results. In this example, the shop floor must have accurate information to process the batch of parts. Drawings of the part need to be clear, understandable and applicable within the context of the equipment and talent available. If the project workflow includes standardized screening methods to review customer provided drawings we can head off precious time wasted if inadequate information escapes the workflow and is released to the shop only to be re-routed back through the project workflow for clarification. The opportunity in this example is to ensure that standardized processes reduce small batch risks and support improved workflow results.
Coming down the Learning Curve (Solid Red Line) in the manner that incoming design specifications are accurately communicated, we reduce waste by eliminating the time typically required to fix errors. Learning is in relation to improved workflow, as project management methods improve and the hours consumed decline. This opportunity to improve delivery requires a shift in organizational thinking, from making parts and parts as the deliverable to managing projects and as having project completion as the deliverable.
The Lesson for Managers: While most businesses are not making aircraft from the ground up, they are processing information and executing activities. Regardless of the product or service, efficient and effective delivery is must for survival. Understanding the Learning Curve can be critical to ensuring delivery. While TP Wright’s original Learning Curve focused on the cost of making parts, it provides valuable lessons for us as managers when we expand its basic tenants and apply them to all the ways
Further reading: Factors Affecting the Cost of Airplanes, T.P. Wright, Journal of Aeronautical Sciences, February 1936
The Learning Curve, Gary Anthes,
Computerworld, July 2, 2001 © 2019
Praxis Analytics Inc.
All Rights Reserved.

Advertisement