Characteristics of the Covered Unemployed in May 2020
by Anna Johnson, Senior Economic Analyst, for Employment in Oregon
Since public health measures began to combat the rapid spread of COVID-19 virus, Oregon has seen an unprecedented and devastating impact on the economy. Along with the monthly employment and unemployment numbers, there is data available every month on the demographic composition of Unemployment Insurance claimants.
The demographic data shown here comes from the Program for Measuring Insured Unemployed Statistics (PROMIS). The data does not provide detailed information for every continued claim that was filed during the month. The data are based on the universe of those who filed a continued claim for regular Unemployment Insurance in the week containing the 19th of the month, which reflects unemployment during the week of the 12th. This corresponds with the Bureau of Labor Statistics Current Population Survey. This also corresponds to the monthly unemployment rate and employment figures. This data set also excludes non-Oregon residents and any claimants that had reported earnings during the reference week of the 12th. The purpose of the data below is to get an idea of who is unemployed and receiving Unemployment Insurance.
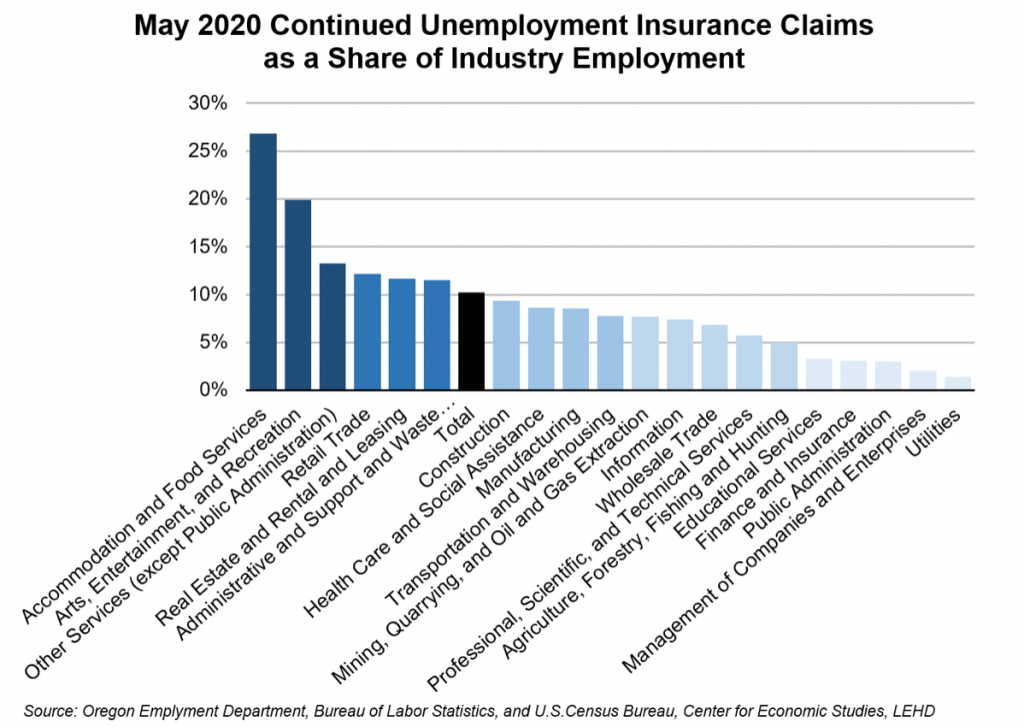
In the first three months of 2020, an average of 25,500 people filed a continued claim for Unemployment Insurance. In April, that number rose to about 194,500 and remained at 194,000 in May. As would be expected, accommodation and food services has been the hardest hit industry during the crisis. In May 2020, this industry made up almost 50,000 of total continued claims. This amount of claims represented nearly 27 percent of second quarter 2019 employment in that industry. Arts, entertainment, and recreation was the next hardest hit industry. Museums, ski resorts, zoos, and other recreation companies have close or seen their activity slowed. Other services, which includes personal care services like fitness instructors, childcare workers, barbers/stylists, massage therapists, and pet groomers, was also hit significantly relative to its industry employment.
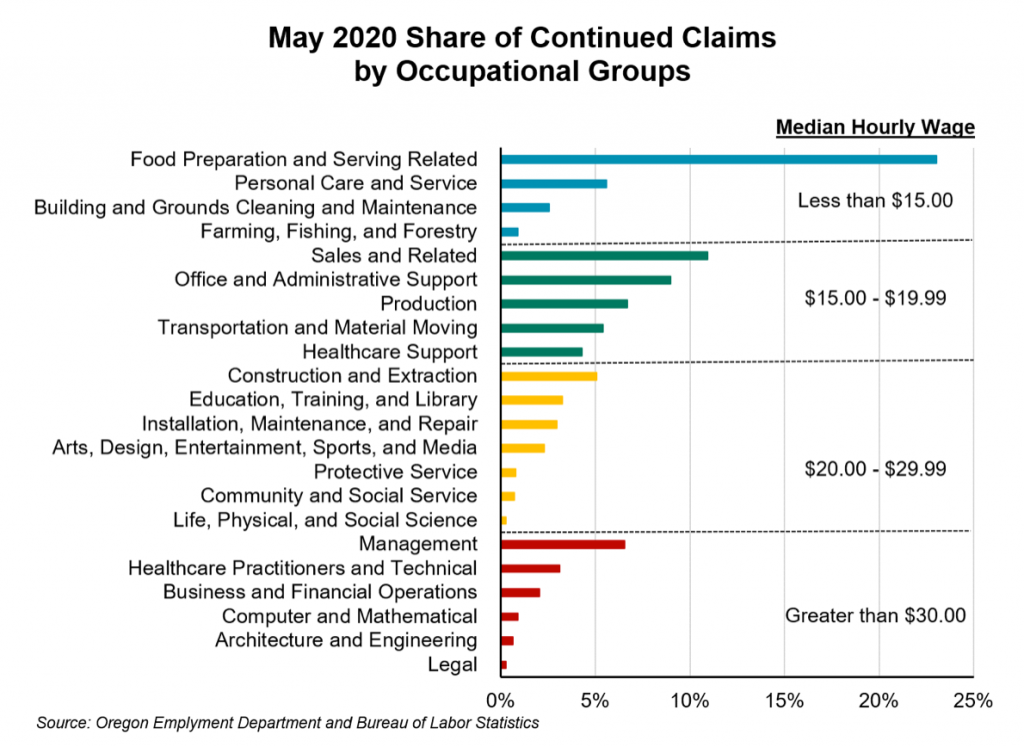
On the occupation side, food preparation and serving occupations represented the largest share of May 2020 continued claims. Before the COVID-19 public health restrictions were put into place, these occupations only made up 6 percent of continued claims. This occupational group also has some of the lowest wages in Oregon, with a median hourly wage of less than $15.00. Lower paying occupational groups has higher shares of continued claims than higher paying occupational groups.
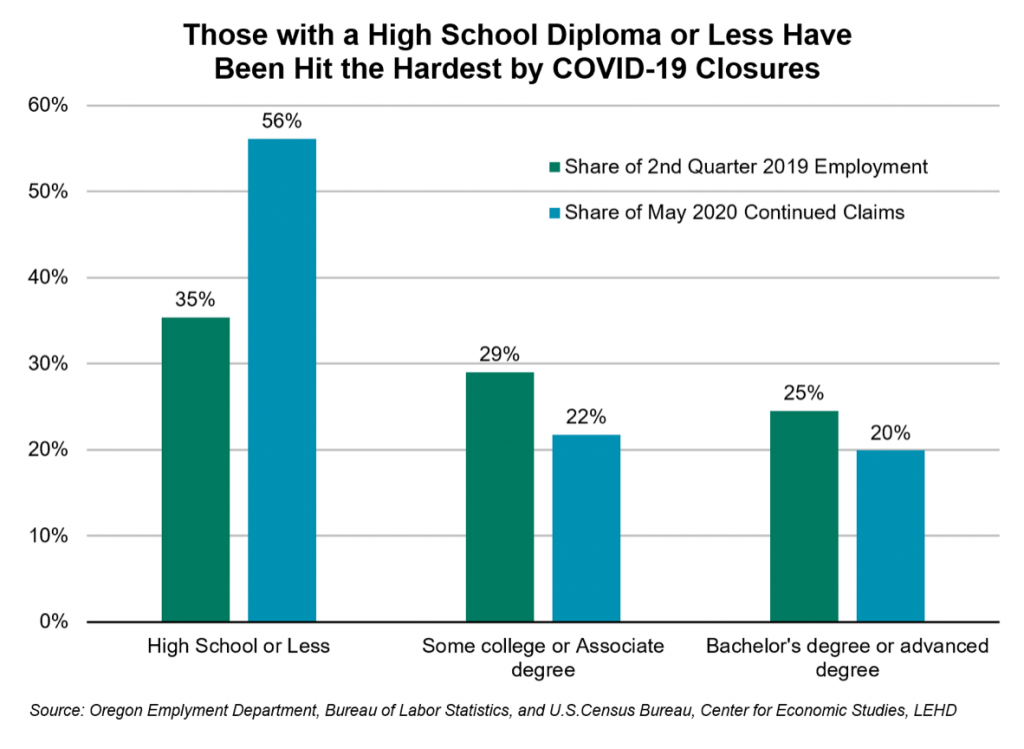
When comparing the level of education for recent unemployment insurance claimants with the educational attainment of the entire labor force, it’s clear that those with lower levels of education have been hit particularly hard. This is likely a reflection of the industries most impacted by COVID-19 related closures, such as leisure and hospitality, construction, retail, and manufacturing which have a higher concentration of workers with a high school diploma or less. Around 56 percent of May continued unemployment insurance claims were by individuals with a high school diploma or less, a significantly higher share than the 35 percent of the labor force they account for.
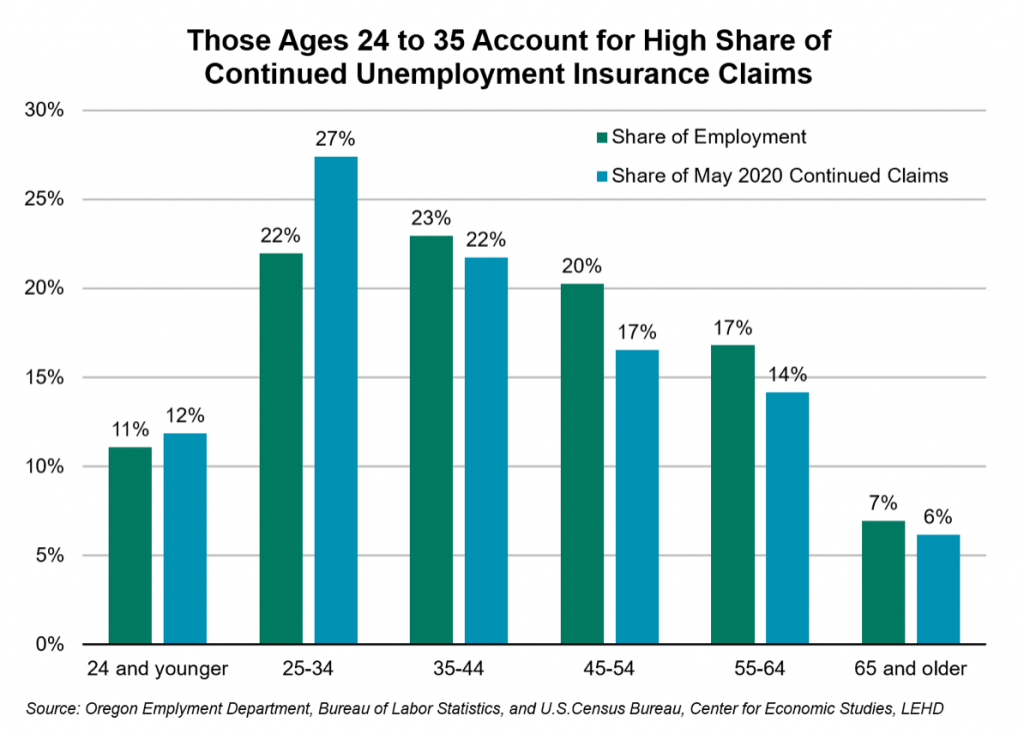
The age distribution of the unemployment insurance claimants is fairly typical of the labor force more broadly, with a few exceptions. Those ages 25 to 34 have been particularly hard hit. They accounted for roughly 27 percent of all unemployment insurance claimants in May, but only 22 percent of the total labor force. This age group accounts for a larger share of the jobs in industries most impacted by COVID-19 related closures. It could also be that this group represents workers earlier in their career and they were more susceptible to layoffs than higher level managers or supervisors.
While filing for unemployment benefits claimants are asked their gender, race, and ethnicity. These questions are not mandatory, resulting in a significant amount of non-response. In May 2020, about 43 percent of claims did not have information available for the gender category. Before COVID-19, men represented about 61 percent of continued claimants. After COVID-19 closures, men and women each made up about 28 percent of continued claimants.
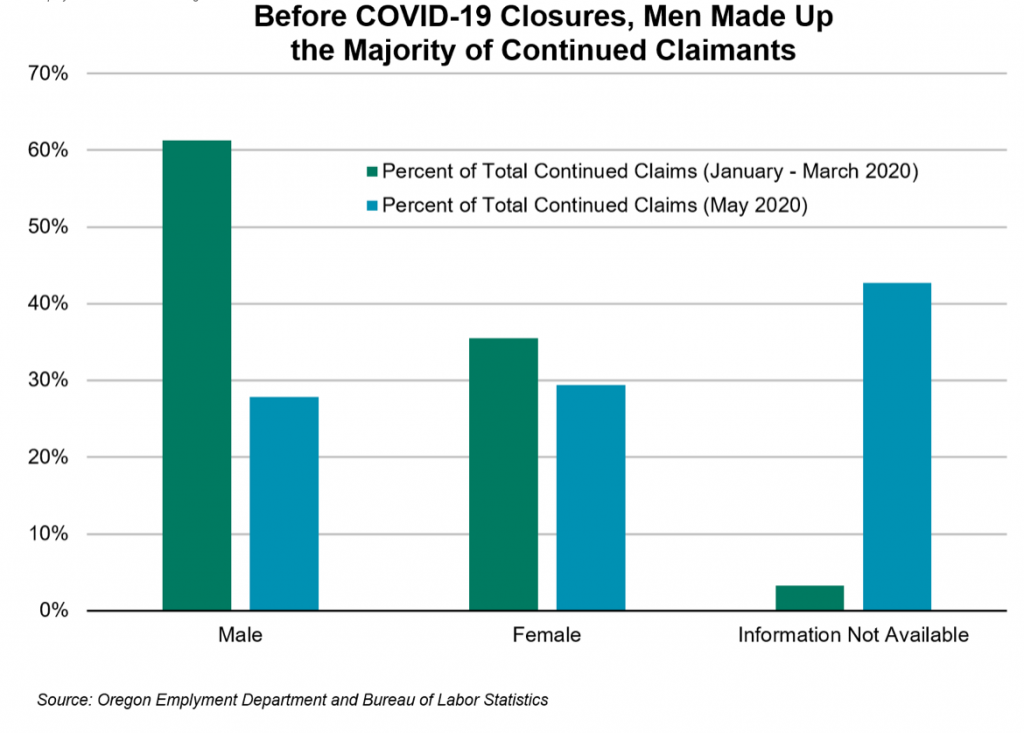
Although we do not know for sure the gender distribution of the “information not available” category, we can make some educated guesses. Based on data from the U.S. Census Bureau’s American Community Survey, women represent the majority of employed workers in many of the industries hardest hit by recent layoffs, including accommodation and food services (57%); health care and social assistance (76%); and other services (55%). With women also representing a larger share of layoffs than is typical, it is likely that women are being disproportionally impacted by these COVID layoffs.
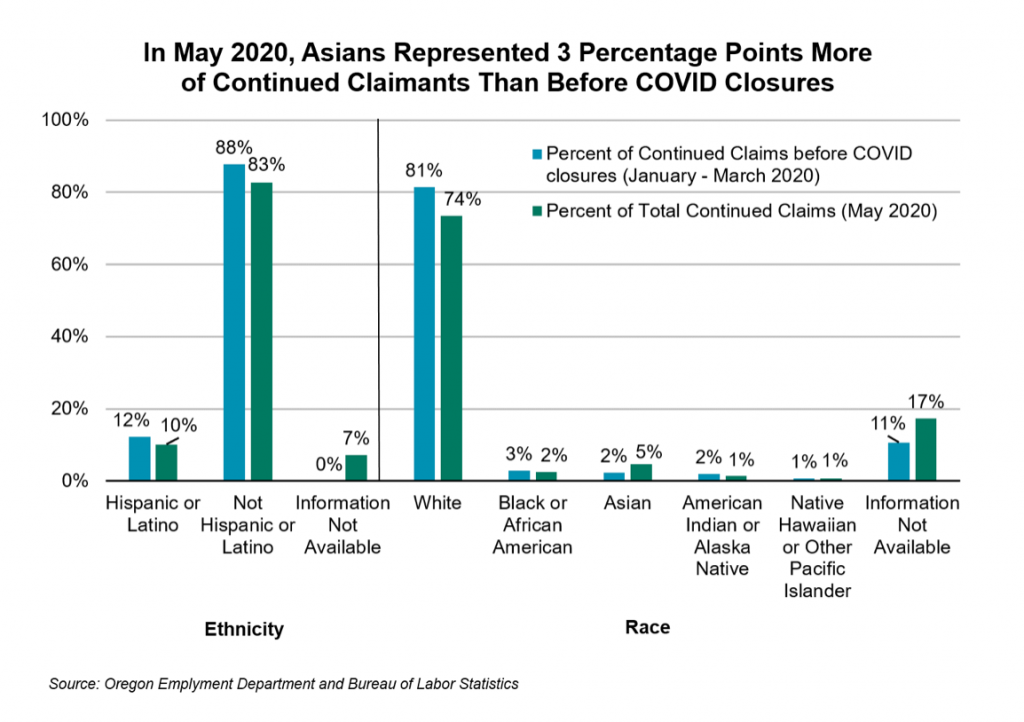
There are similar non-response issues with race. Roughly 17 percent of the unemployment insurance continued claims with some demographic information did not include race. Additionally, no unemployment insurance claimants were coded into the “two or more races” category. The racial and ethnic breakout of the COVID unemployed looks similar to Oregon’s unemployed before the outbreak. With the data that we do have, Asians percentage of continued claims increased by about 3 percentage points between early 2020 and May 2020. However, similar to gender it is difficult to definitively state that all racial and ethnic groups are being impacted similarly relative to their size, as the non-response rate is high enough to leave open some uncertainty.
This is a difficult time for many of us. In addition to the emotional toll this global pandemic is taking, many Oregonians are also struggling with the economic realities of being unemployed. For additional information about unemployment insurance and updates regarding new federal programs go here. For more demographic information on continued claims by county, please visit the COVID-19 page on QualityInfo.org.

Advertisement